American Statistical Association
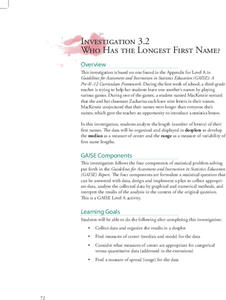
Who Has the Longest First Name?
Name that statistic! Classmates each write their name and the number of letters in it on a sticky note to place on the board. As a class, they determine the median, mode, and range of the name lengths, and create a dot plot of the data....
American Statistical Association
Nonlinear Modeling: Something Fishy
There are plenty of fish in the sea, but only a few good resources on regression. Young mathematicians first perform a linear regression analysis on provided weight and length data for fish. After determining that a linear model is not...
American Statistical Association
A Tale of One City and Two Lead Measurements
Lead the way in learning about lead contamination. Pupils first read several articles about the Flint water crisis and the EPA's rules for lead concentration. They use provided data from 71 Flint water wells to compute the 90th...
American Statistical Association
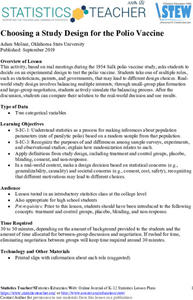
Choosing a Study Design for the Polio Vaccine
Be on the right side of history. Scholars first learn about polio and the meetings of the 1954 Salk polio vaccine study. In groups, they select roles, such as parents, government officials, and statisticians, and decide on the best...
American Statistical Association
How Long Are the Words in the Gettysburg Address?
It's 268 words, but one only needs to consider 10 of them at a time. A data collection and analysis activity has learners investigate the lengths of words in the Gettysburg Address. They first self-select a sample of 10 words and...
American Statistical Association
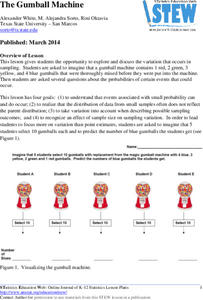
The Gumball Machine
Chew on an activity for probability. Given information on the number of gumballs in a gumball machine, scholars consider how likely it is to randomly draw a blue gumball and how many of each color they would draw in 10 trials if the...
American Statistical Association
The Mean and Variability from the Mean
Discover the mean from fair share to the balance point. The instructional activity takes small groups of pupils through two different interpretations of the mean, the fair share understanding of the mean, and the balance point. Scholars...
American Statistical Association
Speedster
Catch me if you can. Scholars collect data on reaction time by catching a falling ruler or by using an Internet app. They determine the median of the data, create graphs, and analyze the results. They also compare their data to the rest...
American Statistical Association
The Taste of Yellow
Does lemonade taste better when yellow? A tasty experiment has scholars determine the answer to the question. It requires conducting a taste test with lemonades of different colors (from food coloring), and then collecting and analyzing...
American Statistical Association
Spinners at the School Carnival (Unequal Sections)
Everyone's a winner. Scholars analyze a spinner with five unequal sections, three of which represent winning a toy car and the other two represent winning a toy truck. They conduct an experiment to estimate the number of toy cars and...
American Statistical Association
Spinners at the School Carnival (Equal Sections)
Spin to win a toy car. A fun activity has pupils use a spinner in which three of the equal sections represent winning a toy car, and the fourth section represents no car. They record the number of wins after certain numbers of spins,...
American Statistical Association
Candy Judging
Determine the class favorite. The statistics lesson plan has pupils collect, display, and analyze data. Pairs rank four kinds of candy based on their individual preferences. Working as an entire class, learners determine a way to display...
American Statistical Association
Don't Spill the Beans!
Become a bean counter. Pupils use a fun activity to design and execute an experiment to determine whether they can grab more beans with their dominant hand or non-dominant hand. They use the class data to create scatter plots and then...
American Statistical Association
How Long is 30 Seconds?
Is time on your side? Pupils come up with an experiment to test whether their classmates can guess how long it takes for 30 seconds to elapse. They divide the class data into two groups, create box-and-whisker plots, and analyze the...
American Statistical Association
EllipSeeIt: Visualizing Strength and Direction of Correlation
Seeing is believing. Given several bivariate data sets, learners make scatter plots using the online SeeIt program to visualize the correlation. To get a more complete picture of the topic, they research their own data set and perform an...
American Statistical Association
Tell it Like it is!
Scholars apply prior knowledge of statistics to write a conclusion. They summarize using correct academic language and tell the story of the data.
American Statistical Association
Exploring Geometric Probabilities with Buffon’s Coin Problem
Scholars create and perform experiments attempting to answer Buffon's Coin problem. They discover the relationships between geometry and probability, empirical and theoretical probabilities, and area of a circle and square.
American Statistical Association
How Random Is the iPod’s Shuffle?
Shuffle the resource into your lesson repertoire. Scholars use randomly-generated iPod Shuffle playlists to develop ideas about randomness. They use a new set of playlists to confirm their ideas, and then decide whether the iPod randomly...
American Statistical Association
How Fast Are You?
Quick! Snap up the lesson. Scholars first use an online app to collect data on reaction times by clicking a button when the color of a box changes. They then plot and analyze the data by considering measures of center, measures of...
American Statistical Association
Confidence in Salaries in Petroleum Engineering
Just how confident can we be with statistics calculated from a sample? Learners take this into account as they look at data from a sample of petroleum engineer salaries. They analyze the effect sample size has on a margin of error and...
American Statistical Association
More Confidence in Salaries in Petroleum Engineering
Making inferences isn't an exact science. Using data about salaries, learners investigate the accuracy of their inferences. Their analyses includes simulations and randomization tests as well as population means.
American Statistical Association
Chunk it!
Chunking information helps you remember that information longer. A hands-on activity tests this theory by having learners collect and analyze their own data. Following their conclusions, they conduct randomization simulations to...
American Statistical Association
Scatter It! (Using Census Results to Help Predict Melissa’s Height)
Pupils use the provided census data to guess the future height of a child. They organize and plot the data, solve for the line of best fit, and determine the likely height and range for a specific age.
American Statistical Association
Scatter It! (Predict Billy’s Height)
How do doctors predict a child's future height? Scholars use one case study to determine the height of a child two years into the future. They graph the given data, determine the line of best fit, and use that to estimate the height in...


