Curated and Reviewed by
Lesson Planet
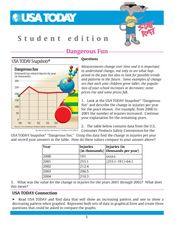
In this line graph worksheet, students analyze the data on a graph about toy-related injuries by year. Students solve 5 problems in which the change in injuries per year is calculated and recorded on a table.
3 Views
12 Downloads
Additional Tags
Resource Details


