Curated and Reviewed by
Lesson Planet
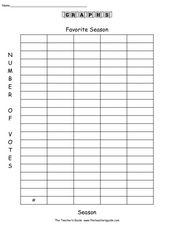
In this graphing worksheet, students conduct a survey of people's favorite survey. They then complete 8 questions about the data gathered before creating a bar graph and pictograph on templates.
3 Views
52 Downloads
Additional Tags
Resource Details


