Curated by
ACT
This Grinnell College: Histograms Area of Rectangles graphic also includes:
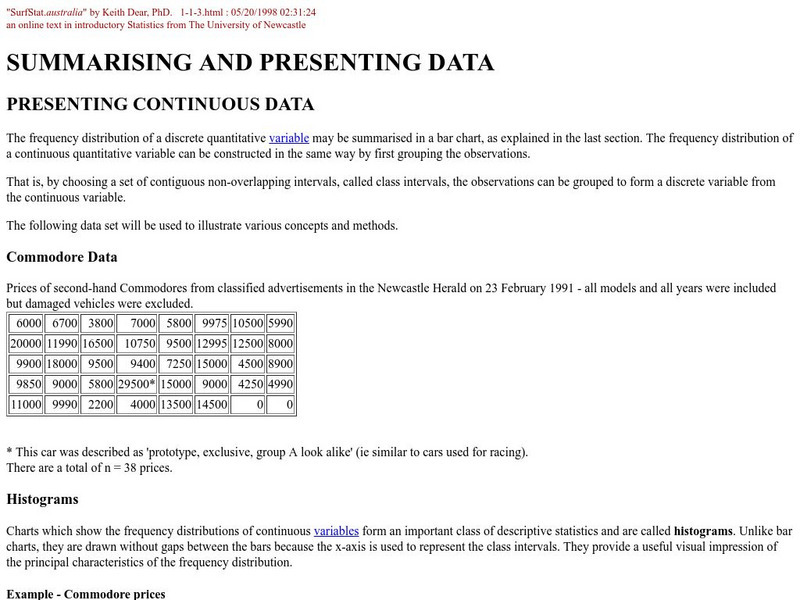
A sample problem is provided to help you create a histogram using a frequency distribution chart. Sample charts and formulas are provided to help explain how to find the area of the rectangles in the histogram and how to interpret what the area means.
3 Views
0 Downloads
CCSS:
Adaptable
Concepts
Additional Tags
Classroom Considerations
- Knovation Readability Score: 5 (1 low difficulty, 5 high difficulty)
- This resource is only available on an unencrypted HTTP website.It should be fine for general use, but don’t use it to share any personally identifiable information

