Curated and Reviewed by
Lesson Planet
This Inferring Relationships Among Sea Surface Salinity & Other Variables in the North Atlantic lesson plan also includes:
- Inferring Relationships Among Sea Surface Salinity & Other Variables in the North Atlantic (.html)
- Earth System Graphic Organizer (Google Slides)
- Earth System Graphic Organizer (.pdf)
- Data Literacy Cube Guide (.html)
- Data Analysis Student Sheet (.pdf)
- Evaporation Rates (.pdf)
- Average Monthly Air Temperatures (.pdf)
- Average Monthly Sea Surface Temperature (.pdf)
- Average Monthly Sea Surface Salinity (.pdf)
- Monthly Evaporation-Precipitation Rates (.pdf)
- Average Monthly Precipitation Rates (.pdf)
- NASA Aquarius Tour
- ScienceCasts: Power of Sea Salt
- Aquarius Sea Surface Salinity Flat Maps 2012
- Activity
- Join to access all included materials
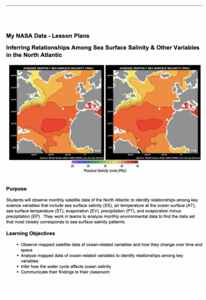
Some say a picture is worth a thousand words—even from a hundred miles away! Learners review satellite data to analyze ocean variables such as temperature, salinity, evaporation, and precipitation. They look for patterns in the data and relationships among the variables.
7 Views
5 Downloads
Concepts
Instructional Ideas
- Have pupils begin by brainstorming reasons why analyzing ocean surface salinity and other quantities provides important data
Classroom Considerations
- Provide each group with an Internet-enabled device
- Expects a basic understanding of properties of solutions
Pros
- Includes all necessary materials
- Provides background information to show relevance
Cons
- None


