Curated by
ACT
This Insightful Interaction: Visualizations graphic also includes:
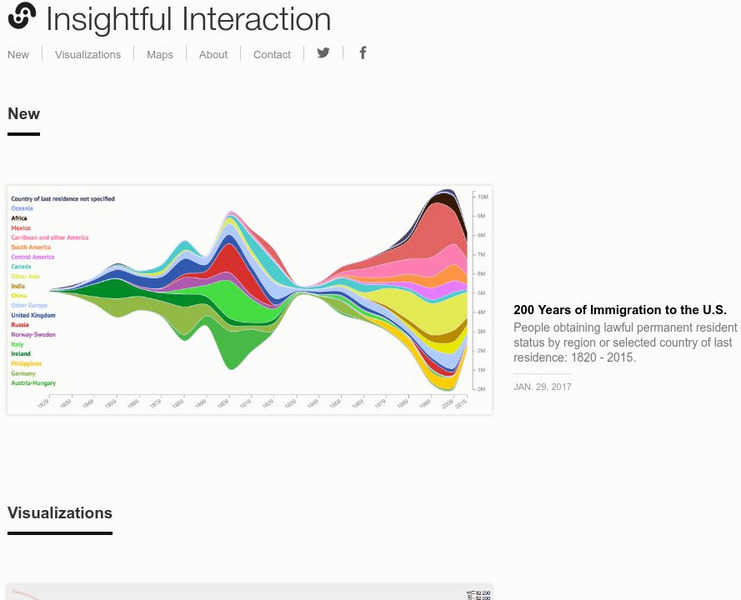
A collection of interactive visualizations that were produced through analysis of economic, political, and market research data. Topics are diverse, e.g., military spending and trade, immigration, consumer spending, crime, unemployment, fossil fuel reserves, etc.
3 Views
0 Downloads
Concepts
Additional Tags
analyzing data, data visualization, arms exporters, arms importers, arms-producing companies, boris nemtsov, coal reserves, corruption perceptions index, defence budgets 2014, girls perform better academically in almost all countries, global consumer expenditure pattern, hate crimes in the u.s., human development index, immigration to israel, immigration to the u.s., insightful interaction: visualizations, lindenmayer system fractal plant, natural gas reserves, oil reserves, spending on luxury goods per capita, unemployment rate map 2013, unmatched singles
Classroom Considerations
- Knovation Readability Score: 4 (1 low difficulty, 5 high difficulty)
- This resource is only available on an unencrypted HTTP website.It should be fine for general use, but don’t use it to share any personally identifiable information

