Curated by
ACT
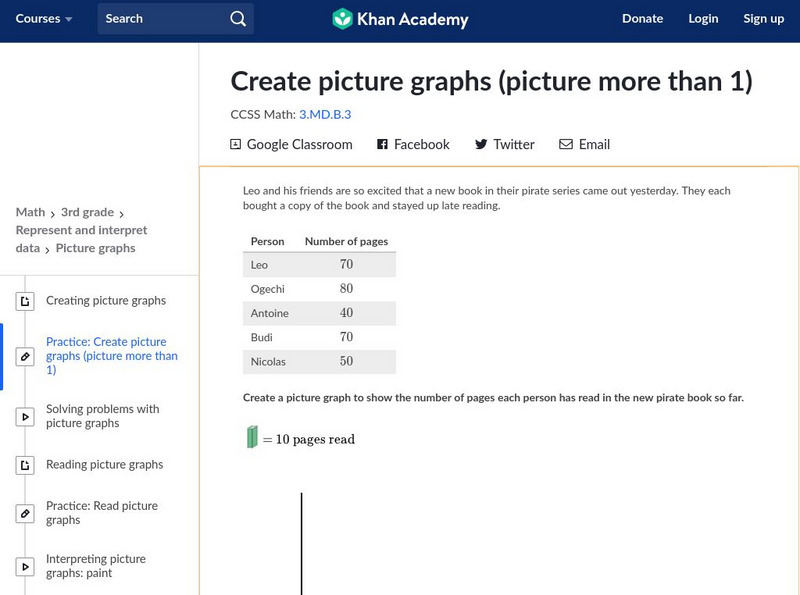
Create and interpret picture graphs. Students receive immediate feedback and have the opportunity to try questions repeatedly, watch a video tutorial, or receive hints about how to create picture graphs. CCSS.Math.Content.3.MD.B.3 Draw a scaled picture graph and a scaled bar graph to represent a data set with several categories
3 Views
0 Downloads
CCSS:
Adaptable
Concepts
Additional Tags
picture graphs, ccss.math.content.3.md.b.3, ccss.math.content.3.md.b.3 draw a scaled picture graph and a scaled bar graph to represent a data set with several categories, create picture graphs, create picture graphs ccss.math.content.3.md.b.3, creating picture graphs, draw a scaled picture graph and a scaled bar graph to represent a data set with several categories, khan academy, khan academy: create picture graphs
Classroom Considerations
- Knovation Readability Score: 2 (1 low difficulty, 5 high difficulty)
- The intended use for this resource is Instructional|practice

