Curated by
ACT
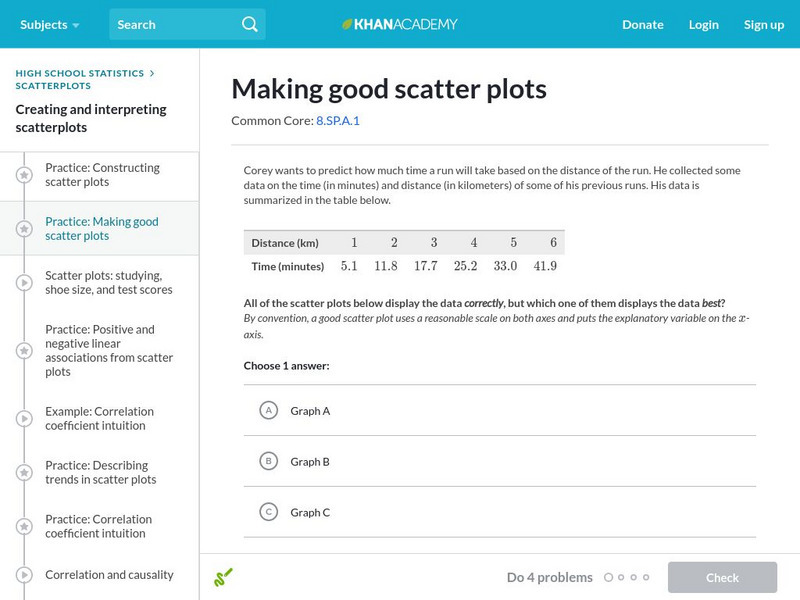
A good scatter plot has the independent variable on the x-axis and the dependent variable on the y-axis. Also, the scale of both axes should be reasonable, making the data as easy to read as possible. In these practice problems, we practice telling good scatter plots from bad ones. Students receive immediate feedback and have the opportunity to try questions repeatedly, watch a video, or receive hints.
3 Views
0 Downloads
CCSS:
Adaptable
Concepts
Additional Tags
Classroom Considerations
- Knovation Readability Score: 4 (1 low difficulty, 5 high difficulty)
- The intended use for this resource is Practice

