Curated and Reviewed by
Lesson Planet
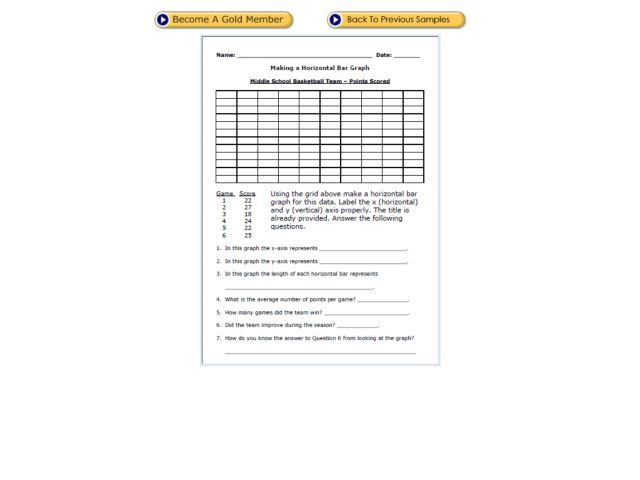
In this bar graph worksheet, learners create a bar graph to display 6 scores from basketball games. Students will label the x and y axis and correctly plot the scores from the table provided.
3 Views
13 Downloads
Additional Tags
Resource Details


