Curated by
ACT
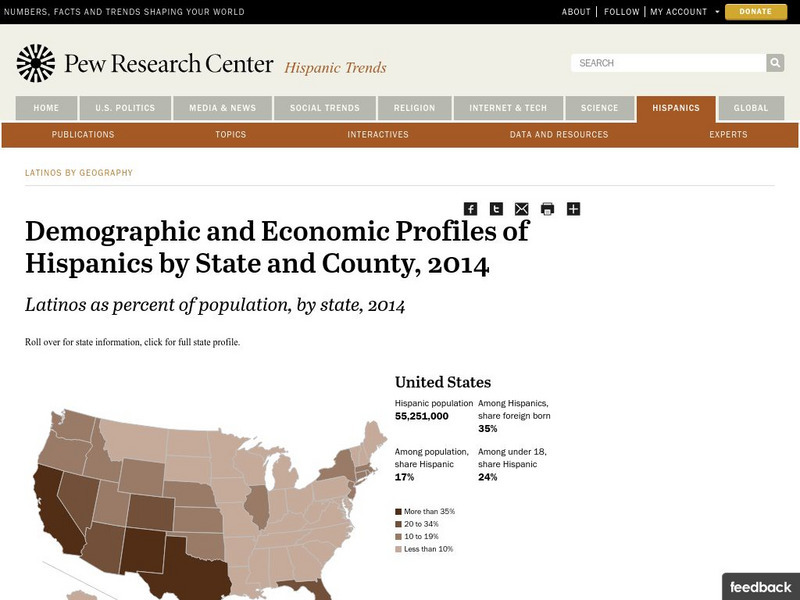
Detailed population maps graphically demonstrate that changing demographics of the Hispanic population in the United States from 1980 to 2007.
3 Views
1 Download
Concepts
Additional Tags
Classroom Considerations
- Knovation Readability Score: 2 (1 low difficulty, 5 high difficulty)
- This resource is only available on an unencrypted HTTP website.It should be fine for general use, but don’t use it to share any personally identifiable information

