Curated by
ACT
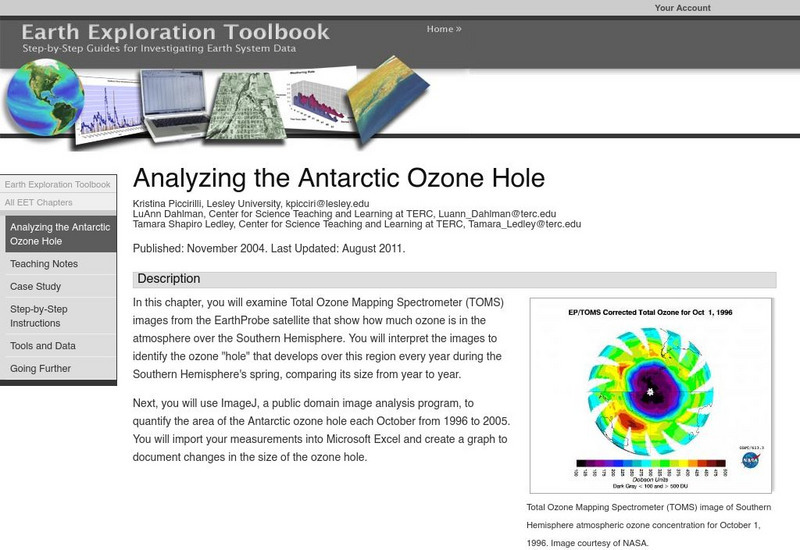
In this chapter, you will examine Total Ozone Mapping Spectrometer (TOMS) images from the EarthProbe satellite that show how much ozone is in the atmosphere over the Southern Hemisphere. You will interpret the images to identify the ozone "hole" that develops over this region every year during the Southern Hemisphere's spring, comparing its size from year to year.
3 Views
0 Downloads
Additional Tags
Classroom Considerations
- Knovation Readability Score: 4 (1 low difficulty, 5 high difficulty)

