Curated and Reviewed by
Lesson Planet
This Stifling, Oppressive, Sweltering, Oh My! lesson plan also includes:
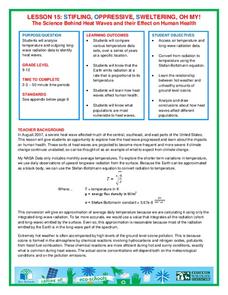
Looking for a hot date? Pick any day in August, statistically the hottest month in the United States. The 15th lesson in the series of 21 instructs pupils to investigate the August 2007 heat wave through NASA data, daily temperature variations for one location, and ground-level ozone concentrations. Learners compare these three variables in order to understand if the heat wave is a weather pattern or one sign of climate change.
15 Views
14 Downloads
CCSS:
Adaptable
Concepts
Additional Tags
Instructional Ideas
- Extend the research with a more recent heat waves, such as those in 2009, 2011, 2012, 2013, or 2016 in the United States
- Review the signs and symptoms of dehydration and heat stroke for those that might be unfamiliar
Classroom Considerations
- Requires prior knowledge of the radiation spectrum and the ozone
Pros
- Includes two pages of tech tips for the programs and data sets used during the lesson
- Provides a long list of links covering the prerequisites, vocabulary, learning links, student resource, and further learning
- Designed to meet the National Science Education Standards, National Education Technology Standards, National Council of Teachers of Mathematics Education Standards, Climate Literacy Principles, and Energy Literacy Principles
Cons
- None


