Curated and Reviewed by
Lesson Planet
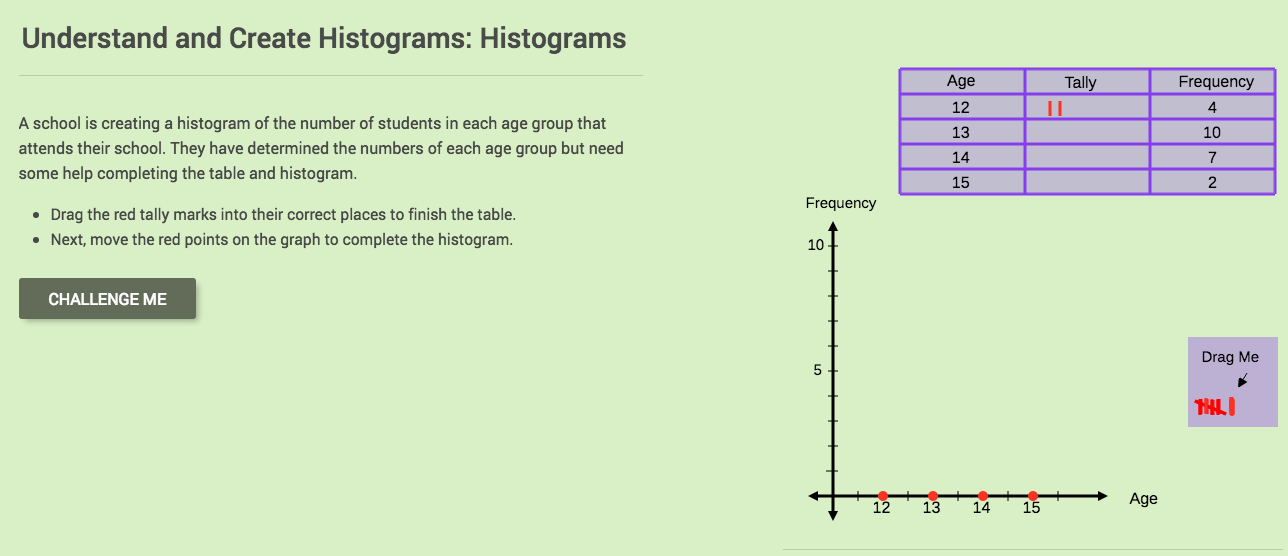
Tally ho! Represent the frequency of ages at school. Pupils finish a tally chart to match the frequencies of ages at school. Using the frequencies, the learners create a histogram. With the aid of the histogram and the frequency table, individuals answer questions about the frequencies.
3 Views
1 Download
CCSS:
Designed
Concepts
Additional Tags
Instructional Ideas
- Determine the frequency of ages at your school and create a histogram
Classroom Considerations
- Users must sign up for a free login account
- The class should understand how to use tally marks
Pros
- Contains hints for questions
- Displays the correct answer if needed
Cons
- None


