Mathed Up!
Pie Charts
Representing data is as easy as pie. Class members construct pie charts given a frequency table. Individuals then determine the size of the angles needed for each sector and interpret the size of sectors within the context of frequency....
World Wildlife Fund
Bar Charts & Pie Charts
Learn about life in the Arctic while practicing how to graph and interpret data with this interdisciplinary lesson. Starting with a whole group data-gathering exercise, students are then given a worksheet on which they analyze and create...
CK-12 Foundation
Pie Charts: Soda Party
Using the interactive, pupils create a pie chart that represents the percentage of sodas bought for a party. Individuals need to determine the percentage and number for the final variety of drinks. The learners determine how the...
Math Worksheets Land
My Favorite Animal At The Zoo Pie Graph
What is your favorite animal at the zoo? Young mathematicians answer eight multiple choice questions, based on a survey of 50 people presented in a pie graph. Additionally, the graph does not display any numbers, but rather...
Math Worksheets Land
Pie or Circle Graphs—Step-by-Step Lesson
How do you display data that you've collected in a pie chart? Follow a clear step-by-step guide to turning survey results into a visible format. It shows kids how to determine the percentage of the whole that each section represents.
Math Worksheets Land
Pie or Circle Graphs - Guided Lesson
A guided lesson worksheet reinforces pie graph skills using a given set of data. Each problem requires young mathematicians to create a circle graph using five colors, and to provide a key that goes along with the graph.
World Wildlife Fund
Graphs and Charts
A two-part worksheet incorporating bar graphs and pie charts, young mathematicians can practice their graphing skills. Pupils answer questions using graphs and charts but are also challenged to create their own using a given set of data.
CK-12 Foundation
Interpretation of Circle Graphs: Northwest Region Population Pie
Given populations of the five Northwestern states, learners create a circle graph. Using the data and the pie chart, they make comparisons between the populations of the states. Finally, the pupils determine how the chart will change...
Math Worksheets Land
Reading and Making Pie Graphs Worksheets
The opportunities are endless with a collection of five worksheets that enable young mathematicians to read pie graphs. Individuals use graphs to answer eight multiple choice questions on each sheet. The set of five allows for...
Math Worksheets Land
Pie or Circle Graphs Problems - Independent Practice Worksheet
Third graders take a set of data and turn it into a pie graph with an independent worksheet. Containing 10 sets of data, the resource reinforced data analysis skills that pupils can use throughout a graphing unit.
Math Worksheets Land
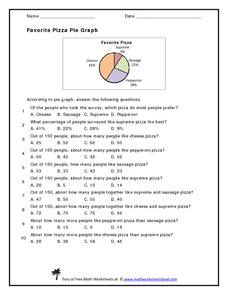
Favorite Pizza Pie Graph
You've heard of a pie graph, but what about a pizza pie graph? Challenge young mathematicians to answer ten questions based on a random survey of people's favorite pizzas. A pie graph displays the percentages of each type of pizza. Some...
Curated OER
Unit VII Energy: WS 1 Qualitative Analysis - Pie Charts
For each of eight diagrams of objects in motion, physics masters draw pie charts to depict the changes in energy. For each they must identify the energy conditions at each position. This is a unique worksheet, perfect for assessing how...
Curated OER
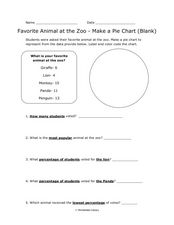
Pie Chart: Favorite Animal at the Zoo
In these three interpreting a pie chart and answering questions worksheets, students use the data provided to label and color code the blank and outlined pie charts, read and interpret a completed pie chart, and then answer questions...
Curated OER
Pies and Percentages--Learning About Pie Graphs
In this pie graph worksheet, students draw a pie graph for the zookeeper with the data he collected, choose a different color for each animal species and make a key to the graph.
Balanced Assessment
Movie Survey
Movie preferences will get your classes talking! Individuals read a pie graph and construct a bar graph using the same information. They then answer questions specific to the data and sample size.
CK-12 Foundation
Conversions between Degrees and Radians: Charting Hours in the Day
Forget hours, divide the day into radians instead. Class members convert the angles in a pie chart of daily activities into radian measures. They add angle measures for multiple activities then determine a relationship between the radian...
PBIS World
Tier 1 Intervention General Tracking Form
Looking for a way to compile data based on behavior interventions? This spreadsheet can help you out! You type in up to five behaviors and five interventions and tally whenever a behavior or intervention is used. The spreadsheet...
Curated OER
Interpret Pie Charts
In this pie chart worksheet, students interpret pie charts, then answer a variety of questions about each. Answers are included on page 2.
Beyond Benign
Municipal Waste Generation
Statistically, waste may become a problem in the future if people do not take action. Using their knowledge of statistics and data representation, pupils take a look at the idea of waste generation. The four-part unit has class members...
Scholastic
Study Jams! Circle Graph
Over a pizza dinner, RJ and Mia discuss how to use a circle or pie graph to represent data. After viewing, data analysts can use a Test Yourself feature to assess their own understanding. This is ideal for use in a flipped classroom lesson.
Curated OER
Pie Graph
Fifth graders examine fractional parts of pie graphs. Given a bag of M&Ms, 5th graders interpret the data. They use a paper plate and colors to create a graph of the types of M&Ms represented.
Curated OER
Pie Charts
The teacher conducts a survey of each student's favorite color. The teacher then creates a pie chart identifying the information gathered. The students display mastery by creating their own pie chart displaying the same information.
Curated OER
Pie Charts
Students create their own pie chart about their total health, being comprised of physical, social, and mental health. They label each section physical, social, and mental, and label each section with the percentage they are trying to...
Curated OER
Reading and Making Pie Graphs
For this pie graphs worksheet, students solve 10 different problems that include reading a pie graph. First, they use the pie graph to respond to 5 questions that follow. Students determine the year that had the smallest and largest...
Other popular searches
- Pie Charts and Graphs
- Interpreting Pie Charts
- Fraction Circles Pie Chart
- Circle Graphs Pie Charts
- Energy Pie Chart
- Reading a Pie Graph
- Creating a Pie Chart
- Bar Graphs, Pie Charts
- Pizza Pie Graph
- Nutrition Facts Pie Graph
- Pie Chart Activity
- M&m Pie Chart


