Curated OER
Nonfiction Books: Table of Contents and Index
How do you find what you're looking for when reading a nonfiction book? Even first graders can learn how to use a table of contents and an index. They use the provided images of each to locate information and answer nine questions.
Curated OER
Contents Page 1 (Table of Contents)
After inspecting the illustrated sample of a Table of Contents provided on a one-page worksheet, primary readers write their responses to five questions based on the model.
Curated OER
Contents and Index
It's important for your readers to understand features of informational text such as index and table of contents, so give them this visual activity to get started. They read a brief explanation of informational text, then look at an...
Curated OER
Table of Contents
In this table of contents worksheet, students read information about the table of contents and use a practice example to answer questions. Students answer four questions using the table of contents.
Mathed Up!
Two Way Tables
When presented with categorical data, a two-way frequency table is a great way to summarize the information. Pupils organize categorical data using a two-way table, then use the tables to determine missing data and to calculate simple...
Mathed Up!
Frequency Tables
The section of a larger General Certificate of Secondary Education math review requires pupils to summarize numerical data presented in a frequency table. Scholars determine the number of data points, the range, the mean, and the...
University of Georgia
Energy Content of Foods
Why do athletes load up on carbohydrates the evening before a competition? The lesson helps answer this question as it relates the type of food to the amount of energy it contains. After a discussion, scholars perform an experiment to...
University of Texas
Matter and the Periodic Table Chemical Families and Periodic Trends
Is assembling the periodic table as simple as Tetris? Scholars arrange colored cards into a logical order and then make connections to the arrangement of the periodic table. Hands-on activities include adding trend arrows and analyzing...
Curated OER
School-Home Links: Table of Contents
In this book section activity, students review the purpose of the table of contents in a book. Students then answer several questions using a table of contents. Parents or guardians must sign the activity.
Curated OER
Making and Interpreting Tables
In this data tables worksheet, students make and interpret data tables given data about magazine sales. They categorize their data, complete their data table and answer questions about their data.
Curated OER
Periodic Table
In this science worksheet, students use explore the crime of the missing elements in order to become more familiar with the Periodic Table.
Inside Mathematics
Conference Tables
Pupils analyze a pattern of conference tables to determine the number of tables needed and the number of people that can be seated for a given size. Individuals develop general formulas for the two growing number patterns and use them to...
Curated OER
Regents High School Examination PHYSICAL SETTING CHEMISTRY 2007
The University of the State of New York has designed a series of exams to be given to high schoolers. This chemistry exam is one of the most comprehensive and well-written that you will ever find. It consists of 84 questions in a variety...
Curated OER
The Atoms Family ~ Atomic Math Challenge
Bold boxes present parts of the periodic table, with some of the contents conveniently missing. Beginning chemists fill in the blanks, which may include the atomic number, atomic mass, atomic symbol, or element name. Beneath each box...
Wordpress
Introduction to Exponential Functions
This lesson begins with a review of linear functions and segues nicely over its fifteen examples and problems into a deep study of exponential functions. Linear and exponential growth are compared in an investment task. Data tables are...
University of Utah
Statistics-Investigate Patterns of Association in Bivariate Data
Young mathematicians construct and analyze patterns of association in bivariate data using scatter plots and linear models. The sixth chapter of a 10-part eighth grade workbook series then prompts class members to construct and interpret...
Curated OER
School-Home Links
Engage parents in their child’s learning process with a School-Home Links worksheet. The one-page resource offers a definition and an example of a book with chapters. With the guidance of their parent or learning partner, the child...
Curated OER
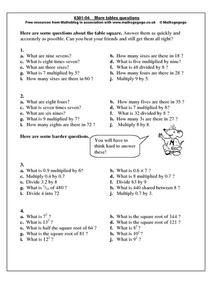
More Tables Questions
In this multiplication worksheet, learners answer 40 short answer questions relating to a table square. Students answer each question as fast and as accurately as they can.
Curated OER
Word Search Y3, 4 x Table
In this math word search worksheet, students solve the 10 multiplication problems at the bottom of the page, which are all in the 4 times table. They then find the numbers, in word form, in the word search above. Students circle the...
Mathed Up!
Straight Line Graphs
Develop graphs by following the pattern. The resource provides opportunities for reviewing graphing linear equations. Pupils create tables to graph linear equations by using patterns whenever possible. The worksheet and video are part of...
Mathed Up!
Drawing Quadratic Graphs
Curve through the points. The resource, created as a review for the General Certificate of Secondary Education Math test, gives scholars the opportunity to refresh their quadratic graphing skills. Pupils fill out function tables to find...
Curated OER
Tables Grids
In this multiplication worksheet, students learn how to fill out a multiplication table or grid. They then fill one out on their own with 36 blank spaces. The answers are on the last page.
California Education Partners
T Shirts
Which deal is best? Learners determine which of two companies has the best deal for a particular number of shirts. They begin by creating a table and equations containing each company's pricing structure. Individuals finish the seventh...
Noyce Foundation
Ducklings
The class gets their mean and median all in a row with an assessment task that uses a population of ducklings to work with data displays and measures of central tendency. Pupils create a frequency chart and calculate the mean and median....
Other popular searches
- Using Table of Contents
- Table of Contents Index
- Table of Contents Sheets
- Table of Contents Worksheets
- Using a Table of Contents
- Table of Contents and Index
- Table of Contents Learning
- Table of Contents Lessons
- Using the Table of Contents
- Table of Contents, Headings


