EngageNY
TASC Transition Curriculum: Workshop 12
How can opinions slant facts? Workshop participants learn how to examine primary and secondary sources and identify the author's point of view. They also examine how visual art impacts the meaning and rhetoric of sources. Full of...
OpenStax
Open Stax: Graphical Analysis of One Dimensional Motion
In the following interactive module students will describe a straight-line graph in terms of its slope and y-intercept. They will determine average velocity or instantaneous velocity from a graph of position vs. time.
Texas Education Agency
Texas Gateway: Kinematics: Graphical Analysis of One Dimensional Motion
By the end of this section, you will be able to describe a straight-line graph in terms of its slope and y-intercept, determine average velocity or instantaneous velocity from a graph of position vs. time, determine average or...
Georgia Department of Education
Ga Virtual Learning: Chemistry: Introduction to Chemistry
This online course guides students through the scientific method with an emphasis on analyzing data and graphical analysis as a foundation to a chemistry course.
Cuemath
Cuemath: Discrete Data
A comprehensive guide for learning all about discrete data with definitions, the difference between discrete and continuous data, graphical representation of discrete data through visualization, solved examples, and interactive questions...
Scholastic
Scholastic: Cultivating Data
Students will understand key concepts of data analysis and their graphic representations. Students will construct and interpret data tables, line plots, box-and-whisker plots and stem-and-leaf plots, scatterplots with line of best fit,...
Georgia Department of Education
Ga Virtual Learning: Poetry Analysis Tp Castt [Pdf]
This two-page PDF includes a Poetry Analysis format using the acronym TP--CASTT. It explains how to evaluate a poem. It is followed by the blank form for students to use when analyzing a poetry.
Texas Education Agency
Texas Gateway: Recognizing Misuses of Graphical or Numerical Information
Given a problem situation, the student will analyze data presented in graphical or tabular form by evaluating the predictions and conclusions based on the information given.
Sophia Learning
Sophia: Creating Graphic Organizers
This tutorial focuses on creating graphic organizers for a variety of purposes. It presents the following types of organizers, their uses, and the format of each: the Cornell method, charting method, cause and effect organizers, flow...
Texas Education Agency
Texas Gateway: Analyze Graphical Sources: Practice 2 (English I Reading)
This lesson focuses on practice exercises to understand and interpret the data in a graphic representations including pie charts, bar graphs, and line graphs.
US Environmental Protection Agency
Epa: Air Data
The AirData website gives you access to air quality data collected at outdoor monitors across the United States, Puerto Rico, and the U. S. Virgin Islands. The data comes primarily from the AQS (Air Quality System) database. You can...
Science Buddies
Science Buddies: Interpreting Area Data From Maps vs. Graphs
Graphical methods of data presentation are a key feature of scientific communication. This project asks the question, "What's the best way to compare the land area of states: a map or a bar graph?" You'll be measuring performance on two...
TES Global
Tes: Character Analysis
[Free Registration/Login Required] A downloadable graphic organizer for analyzing a character is provided on this page.
Polk Brothers Foundation Center for Urban Education at DePaul University
De Paul University: Center for Urban Education: I Can Draw Conclusions: History Analysis [Pdf]
Graphic organizers are provided to help analyze the importance of people in history and to place events in chronological order. Guiding questions are provided to help guide students
Yale University
Yale University: Categorical Data Examples
Site provides some different examples of categorical data and discusses the use of two-way tables.
National Council of Teachers of Mathematics
The Math Forum: Data Collecting in the Classroom
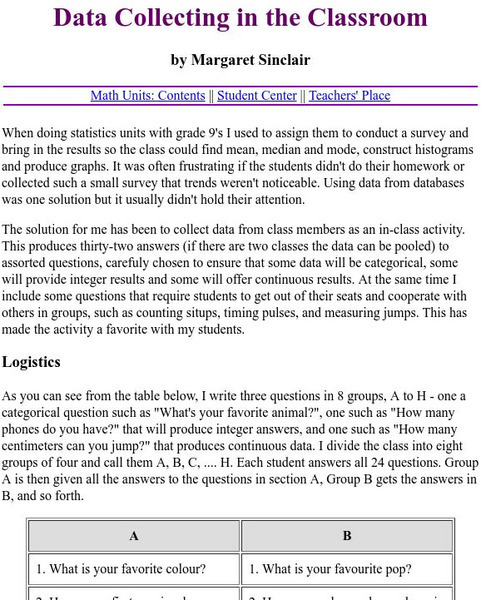
A list of two dozen questions students can easily ask eachother in the classroom to quickly collect data in hopes of using it in their study of making graphs. Some are opinion questions, while others require the counting of certain items...
Texas Education Agency
Texas Gateway: Evaluating Data in Tables, Graphs and Charts
[Accessible by TX Educators. Free Registration/Login Required] In this lesson students look at examples of graphics, tables, charts, and graphs, and learn how to interpret their data. They will be able to use this skill to enhance their...
PBS
Pbs Learning Media: Finch Beak Data Sheet [Pdf]
This graphic from Ecology and Evolution of Darwin's Finches by Peter Grant presents data from the Galapagos Islands, showing that a severe drought put selective pressure on the population of Darwin's finches and resulted in a change in...
TeachEngineering
Teach Engineering: Program Analysis Using App Inventor
In computer science, program analysis is used to determine the behavior of computer programs. Flow charts are an important tool for understanding how programs work by tracing control flow. Control flow is a graphical representation of...
Association of Religion Data Archives
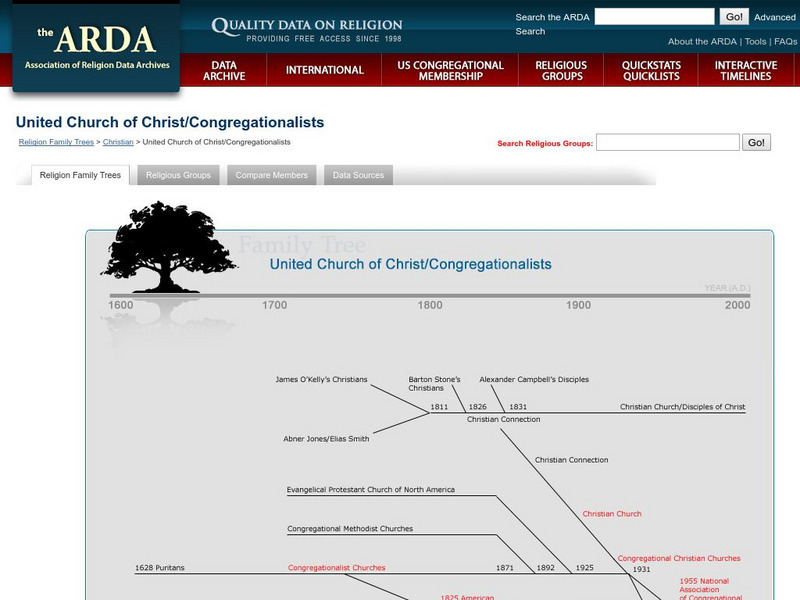
Association of Religion Data Archives: Denominational Family Tree: Congregationalists
A graphic representation giving the various religious sects and groups that make up the United Church of Christ/Congregationalists in the United States along with a timeline. Provides additional information on certain groups when you do...
Association of Religion Data Archives
Association of Religion Data Archives: Denominational Family Tree: Presbyterian Family
A graphic representation giving the various religious sects and groups that make up the Presbyterian church in the United States along with a timeline. Provides additional information on certain groups when you do a mouse-over.
Association of Religion Data Archives
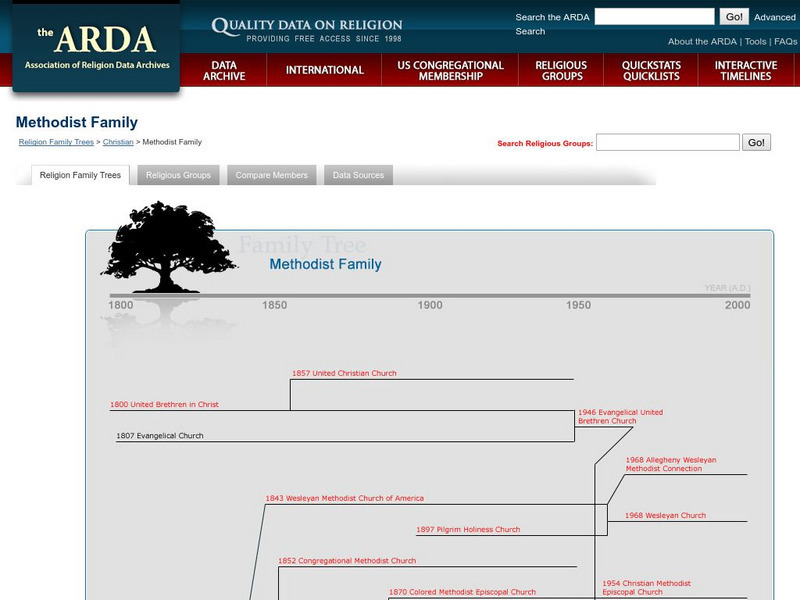
Association of Religion Data Archives: Family Tree: Methodist Church
A graphic representation giving the various religious sects and groups that make up the Methodist church in the United States along with a timeline. Provides additional information on certain groups when you do a mouse-over.
Association of Religion Data Archives
Association of Religion Data Archives: Family Tree: Mennonite Churches
A graphic representation giving the various religious sects and groups that make up the Mennonite churches in the United States along with a timeline. Provides additional information on certain groups when you do a mouse-over.
Association of Religion Data Archives
Association of Religion Data Archives: Family Tree: Lutheran Church
A graphic representation giving the various religious sects and groups that make up the Lutheran church in the United States along with a timeline. Provides additional information on certain groups when you do a mouse-over.









![Pbs Learning Media: Finch Beak Data Sheet [Pdf] Website Pbs Learning Media: Finch Beak Data Sheet [Pdf] Website](https://content.lessonplanet.com/knovation/original/38853-54307de55e3ff0df41d67fbc6e061b4b.jpg?1661365772)

