PBS
Pbs Learning Media: Communicating at Work
In this interactive lesson, learners will learn the importance of interpersonal communication skills, listening skills, and making a good impression. Students will gather information through reading, activities, and video excerpts from...
AdLit
Ad lit.org: Using Technology to Support Struggling Students
Science learning often involves creating abstract representations and models of processes that we are unable to observe with the naked eye. Learn more about visualizing, representing, and modeling to aid struggling learners.
AdLit
Ad lit.org: Using Technology to Support Struggling Students: Vocabulary
To be scientifically literate, students must be able to express themselves appropriately. Learn how to help struggling students master specific vocabulary and be able to use it in their science writing activities.
Grammarly
Grammarly Handbook: Visuals: Graphs, Charts, and Diagrams
This article explains that graphs, charts, and diagrams are used to display information visually. The choice of what type of graph or chart to use depends on the information to be displayed. Software programs make these much easier to...
Other
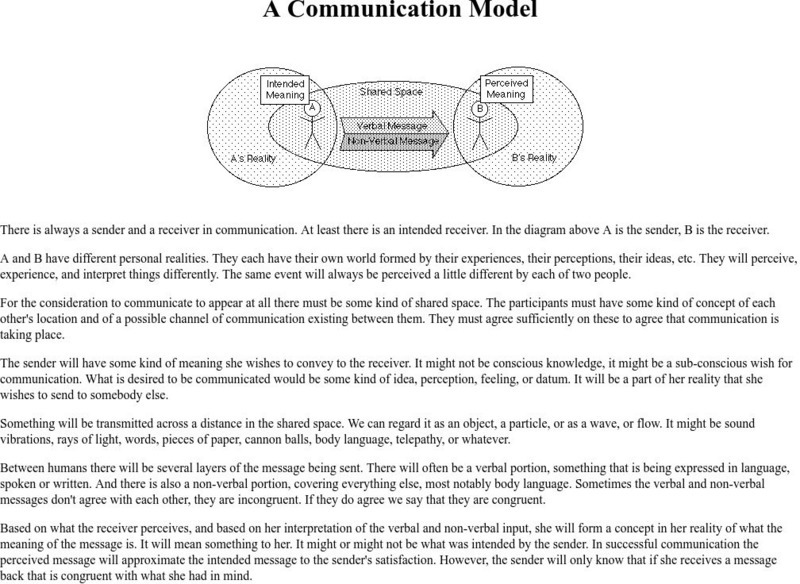
World Transformation: A Communication Model
The site uses stick figures and Venn diagrams to show how communication happens including verbal and nonverbal information. It also includes two exercises to perform.
Other
Write Design: Graphic Organizers
This site explores what graphic organizers are and why they are such valuable instructional tools. Five main types of organizers are addressed: webs, charts, trees, chains, and sketches.
Other
Write Design: Graphic Organizers: Brainstorm
Lists and describes several types of graphic organizers which fall under the "brainstorming" mold, including synectics, webs, cerebral charts, and network trees.
Other
Increased Comprehension With the Use of Imagery
Designed for adult learners, this literacy instructional activity could easily be used in the high school or middle school classroom. Some handouts are included, but some material must be found in a newspaper or magazine.
Other
Association for Computing Machinery: Visual Aids and Presentation
Information is presented on the role of visual aids in professional presentations. Article says "no more than six ideas should be presented on a single visual aid" and also gives time suggestions. Although this article is old and uses...
ReadWriteThink
Read Write Think: I Chart
A printable inquiry chart designed to help students ask questions and collect information from various texts when conducting research on any topic. Directions on how to use this type of graphic organizer as well as lists of teaching...
ReadWriteThink
Read Write Think: Raft Writing Template
A printable graphic organizer for students to use while determining their role, audience, format, and topic for a RAFT writing assignment. Directions on how to use this type of graphic organizer as well as lists of teaching ideas and...
ReadWriteThink
Read Write Think: Graffiti Wall: Discussing and Responding to Literature
New ways of thinking about text, collaboration with group members, and presentation skills are all developed with this lesson which could be applied to almost any novel read in class. Includes student handouts, an online interactive, and...
New Zealand Ministry of Education
Nz Ministry of Education: As Far as the Eye Can See
View a variety of television advertisements analyzing visual and verbal features and how these are combined to communicate ideas. Write a coherent essay which expresses and argues a viewpoint about a chosen marketing strategy, linking...
ReadWriteThink
Read Write Think: Oral Presentation Rubric
A printable four-point rubric for use when evaluating oral presentations. The rubric focuses on the specific areas of delivery, content and organization, and enthusiasm and audience awareness. Directions on how to use this rubric as well...
Other
Mediate: Graphic Facilitation Focuses a Group's Thoughts
This article discusses what graphic facilitation is and how it can focus a group's thoughts and understanding. An example is provided showing how it resolved a conflict between two groups.
TES Global
Blendspace: Effective Communication
A learning module with links to texts, images, and videos on how to communicate effectively.
TES Global
Tes: Persuasive Techniques
[Free Registration/Login Required] A graphic organizer is provided to help students analyze persuasuve techniques in an advertisement. Students will analyze an advertisement and apply their understanding of the content.
Sophia Learning
Sophia: Choosing Whether to Use Software or Technology to Enhance Ideas
A tutorial explaining how to use technology to create graphics and visuals to enhance documents and presentations. A brief audiovisual presentation identifies types of visuals, and another audiovisual presentation describes how and when...
Colorado State University
Csu Writing Guides: Creating and Using Overheads
An informational guide on the creation, process, and considerations involved in using an overhead projector and/or transparency. Includes information about when to use overheads, basic design, types of visuals, and using the overheads...
McMaster University
Mc Master University: Making Class Presentations [Pdf]
Comprehensive guide with 17 areas of suggestions and tips for delivering a successful class presentation. Requires Adobe Reader. [PDF] CCSS.ELA-Literacy.CCRA.SL.4, SL.11-12.4 Presentation
Sophia Learning
Sophia: Expository Speeches
This instructional activity is a fun way to practice the elaboration tools needed to back up answers. Students will need to speak about a random topic for one minute without time to prepare. This instructional activity helps students...
ReadWriteThink
Read Write Think: Designing Effective Poster Presentations
Contains plans for six or seven lessons that teach students to create and present effective poster presentations. In addition to objectives and standards, this instructional plan contains links to PDF handouts and sites used in the...
Colorado State University
Colorado State Writing Center: Charts
The use of charts and graphs can improve your presentations, whether on paper or as visual aids. Here you can read about how to create line, column, bar, pie graphs, and scatterplots. Just follow the links to their respective pages.
Texas Education Agency
Texas Gateway: Synthesize Information in Charts and Graphs (English Ii Reading)
Synthesize information that you find in charts and graphs.


