Polar Trec
Playground Profiling—Topographic Profile Mapping
The Kuril islands stretch from Japan to Russia, and the ongoing dispute about their jurisdiction prevents many scientific research studies. Scholars learn to create a topographic profile of a specific area around their schools. Then they...
CK-12 Foundation
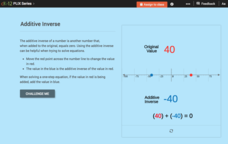
One-Step Equations and Inverse Operations: Additive Inverse
Reinforce properties while solving equations. Learners often ignore properties even as they try to apply them. A well-designed lesson emphasizes the role of additive inverses when solving equations.
CK-12 Foundation
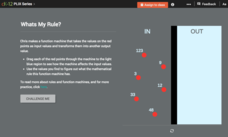
Function Rules for Input-Output Tables: Whats My Rule?
What's the rule that makes it true? A virtual function machine generates output values as learners submit the input values. Their job is to analyze the inputs and outputs for a pattern and write a function rule.
CK-12 Foundation
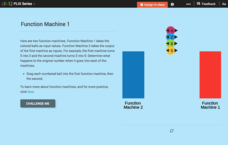
Function Rules for Input-Output Tables: Function Machine 1
Challenge your classes to find the pattern of a double function machine. After recording the outputs of both machines, learners identify the pattern and the corresponding function. Both patterns involve adding/subtracting a constant.
CK-12 Foundation
Function Rules for Input-Output Tables: Function Machine!
Watch as a function machine converts an input to an output. Learners determine the work applied by the function machine to write a function rule. Questions accompany the function machine animation to guide individuals to conclusions.
CK-12 Foundation
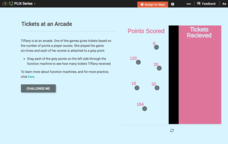
Function Rules for Input-Output Tables: Tickets at an Arcade
This is the ticket to learning about function rules! Using online manipulatives, scholars build a table of values and then answer questions about the related function. They examine the relationship between the input and output values and...
CK-12 Foundation
Function Rules for Input-Output Tables: Soda Sugar Function Table
Examine the relationship between the input and output variables in a table of values. As learners build an input-output table using online manipulatives, they begin to identify patterns. They answer questions about these patterns and...
CK-12 Foundation
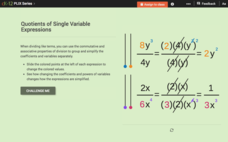
Simplify Products or Quotients of Single Variable Expressions: Quotients of Single Variable Expressions
Investigate division within an algebraic term using an inquiry-based lesson. Individuals adjust sliders and watch as the simplification of the term changes. Questions help guide them to important conclusions.
CK-12 Foundation
Simplify Products or Quotients of Single Variable Expressions: Circling C's
Model expression division using online manipulatives. Learners drag C's representing a term into equal groups. Guiding questions help them see their groups as the division of the term.
CK-12 Foundation
Simplify Sums or Differences of Single Variable Expressions: Addition and Subtraction of Like Terms
Investigate the process of combining like terms using an interactive animation. Scholars tackle simplifying expressions by manipulating rectangles that represent the terms. They add and subtract terms to arrive at the result.
CK-12 Foundation
When to Use the Distributive Property: Rational Expressions
Discover how the distributive property applies to division. As learners change numeric values within an expression, the simulation calculates its value. Challenge questions lead individuals to realize the power of distributing the...
CK-12 Foundation
Distributive Property: Catching Fireflies
Model the distributive property with jars of fireflies! An interactive animation has learners manipulate the number of jars of fireflies to determine the number caught. Accompanying questions ask scholars to consider the multiplication...
NOAA
Where There's Smoke, There's ...
A remotely operated vehicle approaching a volcano was engulfed by molten sulfur where the plumes of fluids contained the highest concentrations of aluminum ever recorded. This isn't science fiction or an April fools joke, though it did...
National Academy of Sciences
CO2 and Temperature
Scientists can model global surface temperature with and without considering human emissions, but does do these factors really make a difference? Two interactive graphs demonstrate some factors that affect climate change. The first graph...
Space Awareness
Star in a Box
What happens to stars as they get older? A simulation takes pupils through the life cycle of stars based on their masses. The resource introduces the Hertzsprung-Russell diagram and the common relationships and life cycle patterns observed.
Chicago Botanic Garden
What Can Tree Rings Tell Us About Climate?
Tree rings are slightly thicker on the south side of the tree because it receives more sunlight. Part two in a series of five lessons helps learners analyze tree rings to determine the environmental conditions that caused size...
National Wildlife Federation
Why All the Wiggling on the Way Up? CO2 in the Atmosphere
The climate change debate, in the political arena, is currently a hot topic! Learners explore carbon dioxide levels in our atmosphere and what this means for the future in the 11th installment of 12. Through an analysis of carbon dioxide...
Chicago Botanic Garden
Carbon, Greenhouse Gases, and Climate
Climate models mathematically represent the interactions of the atmosphere, oceans, land, sun, surface, and ice. Part two in the series of four lessons looks at the role greenhouse gases play in keeping Earth warm and has participants...
Chicago Botanic Garden
Are Global CO2 Levels Changing?
According to the Mauna Loa observatory, carbon dioxide levels increased by 3 ppm in our atmosphere between 2015–2016. Individuals analyze carbon dioxide data from around the world and then share this with a home group in lesson three of...
Chicago Botanic Garden
Preparing for Project BudBurst
Male deer growing antlers to begin the breeding season is an example of a phenological event. First in a four-part series is an activity requiring individuals to collect phenological data on their campus. Classes discuss phenology, the...
Chicago Botanic Garden
Climate Change Around the World
You know climate change is happening when you see a bee take off its yellow jacket. Part four in a series of five lessons explores all factors affecting climate change: temperature, cloud cover, precipitation, and carbon dioxide. By...
Consortium for Ocean Science Exploration and Engagement (COSEE)
Understanding the Food Web
Building on prior knowledge of the pervious lesson in the series, pupils explain the previous lesson to each other. Then they write a simple guide for a young child to read on the same topic.
PHET
Atomic Interactions
Who knew atoms could be attracted to each other? A simulation allows learners to see how forces between atoms influence the attraction between them. Classes see the attractive and repulsive forces adjusting as distance between atoms...
Polar Trec
Global Snow Cover Changes
Snow is actually translucent, reflecting light off its surface which creates its white appearance. Pairs or individuals access the given website and answer questions about snow cover. They analyze graphs and charts, examine data, and...


