Education Development Center
Rational Exponents
It's rational to root for your class to learn about exponents. Scholars study rational exponents by reading a fictional dialogue between classmates. They analyze the conversation to understand the connection between rational exponents...
Education Development Center
Finding Triangle Vertices
Where in the world (or at least in the coordinate plane) is the third vertex? Given two coordinate points for the vertices of a triangle, individuals find the location of the third vertex. They read an account of fictional...
Education Development Center
Similar Triangles
Model geometric concepts through a hands-on approach. Learners apply similar triangle relationships to solve for an unknown side length. Before they find the solution, they describe the transformation to help identify corresponding sides.
Education Development Center
Integer Combinations—Postage Stamps Problem (MS Version)
Number patterns can seem mysterious. Help your learners unravel these mysteries as they complete an intriguing task. Through examination, collaborative groups determine that they are able to produce all integers above a certain value by...
Education Development Center
Distance, Rate, and Time—Walking Home
Dig into a classic math problem with your classes. Through an engaging task, learners work with rate and distance information to make conclusions. In the task, two people walk at different rates; one leaves first, and scholars calculate...
Education Development Center
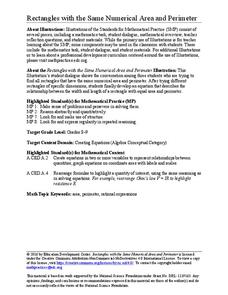
Rectangles with the Same Numerical Area and Perimeter
Is it possible for a rectangle to have the same area and perimeter? If you disregard units, it happens! In a challenging task, groups work to determine the rectangles that meet these criterion. The hope is that learners will naturally...
Education Development Center
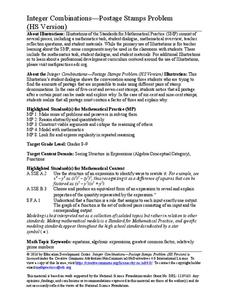
Integer Combinations—Postage Stamps Problem (HS Version)
It seems the post office has run out of stamps! Learners build all the values of postage available if the post office only sells five- and seven-cent stamps. The task provides an opportunity to create an expression in two variables and...
Education Development Center
Creating Data Sets from Statistical Measures
Explore the measures of central tendency through a challenging task. Given values for the mean, median, mode, and range, collaborative groups create a set of data that would produce those values. They then critique other answers and...
Education Development Center
Creating a Polynomial Function to Fit a Table
Discover relationships between linear and nonlinear functions. Initially, a set of data seems linear, but upon further exploration, pupils realize the data can model an infinite number of functions. Scholars use multiple representations...
Education Development Center
Interpreting Statistical Measures—Class Scores
Explore the effect of outliers through an analysis of mean, median, and standard deviation. Your classes examine and compare these measures for two groups. They must make sense of a group that has a higher mean but lower median compared...
Education Development Center
Consecutive Sums
Evaluate patterns of numbers through an engaging task. Scholars work collaboratively to determine a general rule reflecting the sum of consecutive positive integers. Multiple patterns emerge as learners explore different arrangements.
Education Development Center
Making Sense of Unusual Results
Collaboration is the key for this equation-solving lesson. Learners solve a multi-step linear equation that requires using the distributive property. Within collaborative groups, scholars discuss multiple methods and troubleshoot mistakes.
Education Development Center
Choosing Samples
What makes a good sample? Your classes collaborate to answer this question through a task involving areas of rectangles. Given a set of 100 rectangles, they sample a set of five rectangles to estimate the average area of the figures. The...
Indiana Department of Education
Amusement of the Future
Take your class on the ride of their lives! Physical science scholars get an in-depth look at potential and kinetic energies in an amusement park-themed unit. Students research, design, and promote their own amusement parks, complete...
NASA
Resolving 2-Plane Traffic Conflicts by Changing Speed—Problem Set E
What do you do to change arrival times of airplanes when a different route is not available? The fifth interactive in a series of six presents problems where pupils must find solutions to conflicts of safety rules. They must decide how...
NASA
Resolving 3-Plane Traffic Conflicts by Changing Route—Problem Set C
Keep the planes from crashing. Pupils work with three airplanes and change their flight paths to keep them at a safe distance from each other. Individuals work through three problems in the third interactive in a set of six with...
NASA
Resolving 3-Plane Traffic Conflicts by Changing Speed—Problem Set F
Get three planes to line up safely. Individuals work through a set of problems to eliminate spacing conflicts between three airplanes in flight. The pupils use their knowledge to change the airplanes' speed or route to meet a...
EngageNY
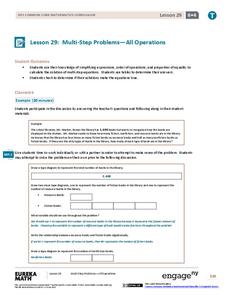
Multi-Step Problems—All Operations
Harness the power of algebra to solve problems. Young mathematicians learn to work out multi-step problems by applying algebraic techniques, such as solving equations and proportions. They use tape diagrams to model the problem to finish...
Mathematics Vision Project
Transformations and Symmetry
Flip, turn, and slide about the coordinate plane. Pupils define the rigid motions and experiment with them before determining the relationships of the slopes of parallel and perpendicular lines. The sixth unit in a nine-part series...
EngageNY
One-Step Equations—Multiplication and Division
Discover one more step to being able to solve any one-step equation. Scholars continue their work with one-step equations in the 28th installment of a 36-part module. Tape diagrams and algebraic processes introduce how to solve one-step...
EngageNY
Describing Center, Variability, and Shape of a Data Distribution from a Graphical Representation
What is the typical length of a yellow perch? Pupils analyze a histogram of lengths for a sample of yellow perch from the Great Lakes. They determine which measures of center and variability are best to use based upon the shape of the...
EngageNY
Understanding Box Plots
Scholars apply the concepts of box plots and dot plots to summarize and describe data distributions. They use the data displays to compare sets of data and determine numerical summaries.
EngageNY
Describing Variability Using the Interquartile Range (IQR)
The 13th lesson plan in a unit of 22 introduces the concept of the interquartile range (IQR). Class members learn to determine the interquartile range, interpret within the context of the data, and finish by finding the IQR using an...
EngageNY
Describing a Distribution Displayed in a Histogram
The shape of the histogram is also relative. Learners calculate relative frequencies from frequency tables and create relative frequency histograms. The scholars compare the histograms made from frequencies to those made from relative...


