Statistics Education Web
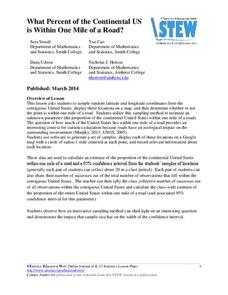
What Percent of the Continental US is Within One Mile of a Road?
There are places in the US where a road cannot be found for miles! The lesson asks learners to use random longitude and latitude coordinates within the US to collect data. They then determine the sample proportion and confidence interval...
Statistics Education Web
Are Female Hurricanes Deadlier than Male Hurricanes?
The battle of the sexes? Scholars first examine data on hurricane-related deaths and create graphical displays. They then use the data and displays to consider whether hurricanes with female names result in more deaths than hurricanes...
Statistics Education Web
Double Stuffed?
True or false — Double Stuf Oreos always contain twice as much cream as regular Oreos. Scholars first measure the masses of the filling in regular Oreos and Double Stuf Oreos to generate a class set of data. They use hypothesis testing...
Statistics Education Web
I Always Feel Like Somebody's Watching Me
Future statisticians and potential psychics first conduct an experiment to collect data on whether a person can tell if someone is staring at them. Statistical methods, such as hypothesis testing, chi-square tests, binomial tests, and...
Statistics Education Web
Odd or Even? The Addition and Complement Principles of Probability
Odd or even—fifty-fifty chance? Pupils first conduct an experiment rolling a pair of dice to generate data in a probability lesson. It goes on to introduce mutually exclusive and non-mutually exclusive events, and how to use the Addition...
EngageNY
Newton’s Law of Cooling, Revisited
Does Newton's Law of Cooling have anything to do with apples? Scholars apply Newton's Law of Cooling to solve problems in the 29th installment of a 35-part module. Now that they have knowledge of logarithms, they can determine the decay...
EngageNY
The Graph of the Natural Logarithm Function
If two is company and three's a crowd, then what's e? Scholars observe how changes in the base affect the graph of a logarithmic function. They then graph the natural logarithm function and learn that all logarithmic functions can be...
EngageNY
Logarithms—How Many Digits Do You Need?
Forget your ID number? Your pupils learn to use logarithms to determine the number of digits or characters necessary to create individual ID numbers for all members of a group.
Statistics Education Web
The United States of Obesity
Mississippi has both the highest obesity and poverty rate in the US. Does the rest of the data show a correlation between the poverty and obesity rate in a state? Learners tackle this question as they practice their skills of regression....
Statistics Education Web
The Case of the Careless Zookeeper
Herbivores and carnivores just don't get along. Using a box of animal crackers, classes collect data about the injury status of herbivores and carnivores in the box. They complete the process of chi-square testing on the data from...
Statistics Education Web
Saga of Survival (Using Data about Donner Party to Illustrate Descriptive Statistics)
What did gender have to do with the survival rates of the Donner Party? Using comparative box plots, classes compare the ages of the survivors and nonsurvivors. Using the same method, individuals make conclusions about the gender and...
Statistics Education Web
Consuming Cola
Caffeine affects your heart rate — or does it? Learners study experimental design while conducting their own experiment. They collect heart rate data after drinking a caffeinated beverage, create a box plot, and draw conclusions. They...
Statistics Education Web
Types of Average Sampling: "Household Words" to Dwell On
Show your classes how different means can represent the same data. Individuals collect household size data and calculate the mean. Pupils learn how handling of the data influences the value of the mean.
Statistics Education Web
Text Messaging is Time Consuming! What Gives?
The more you text, the less you study. Have classes test this hypothesis or another question related to text messages. Using real data, learners use technology to create a scatter plot and calculate a regression line. They create a dot...
Statistics Education Web
Did I Trap the Median?
One of the key questions in statistics is whether the results are good enough. Use an activity to help pupils understand the importance of sample size and the effect it has on variability. Groups collect their own sample data and compare...
Statistics Education Web
First Day Statistics Activity—Grouping Qualitative Data
Making groups of groups can help to organize data. Classes use statistics to group themselves using descriptive adjectives. The objective is for learners to understand that grouping qualitative data is useful when the original groups are...
Statistics Education Web
10,000 Steps?
Conduct an experiment to determine the accuracy of pedometers versus pedometer apps. Class members collect data from each device, analyze the data using a hypothesis test, and determine if there is a significant difference between the...
Statistics Education Web
Now You SeeIt, Now You Don't: Using SeeIt to Compare Stacked Dotplots to Boxplots
How does your data stack up? A hands-on activity asks pupils to collect a set of data by measuring their right-hand reach. Your classes then analyze their data using a free online software program and make conclusions as to the...
Mathematics Assessment Project
Deducting Relationships: Floodlight Shadows
Try to figure out what happens with shadows as a person moves between two light sources. A formative assessment instructional activity has individuals work on an assessment task based on similar triangles, then groups them based on their...
Statistics Education Web
You Will Soon Analyze Categorical Data (Classifying Fortune Cookie Fortunes)
Would you rely on a fortune cookie for advice? The lesson first requires future statisticians to categorize 100 fortune cookie fortunes into four types: prophecy, advice, wisdom, and misc. The lesson goes on to have learners use...
EngageNY
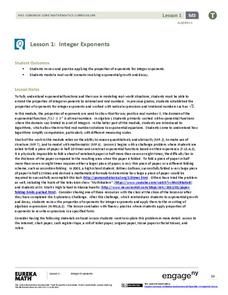
Integer Exponents
Fold, fold, and fold some more. In the first installment of a 35-part module, young mathematicians fold a piece of paper in half until it can not be folded any more. They use the results of this activity to develop functions for the area...
Mathematics Assessment Project
Solving Quadratic Equations
Scholars first complete an individual assignment using a quadratic equation to model the movement of a bus around a corner. Learners then discuss their solutions with classmates and analyze the provided sample responses.
Mathematics Assessment Project
Estimating Volume: The Money Munchers
Don't stuff money under your mattress. To find out why learners first complete a task determining how $24,000 in cash would affect the height of a mattress and whether this same amount would fit into a suitcase of given dimensions. They...
EngageNY
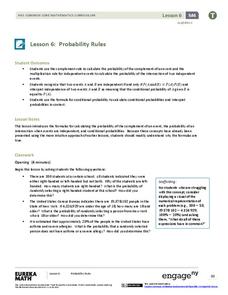
Probability Rules (part 1)
In statistics, probability rules—literally! Learners use their previous knowledge and explore a set of rules for conditional probability, independent probability, and complements. Given different scenarios, they must determine what type...


