Noyce Foundation
Perfect Pair
What makes number pairs perfect? The resource provides five problems regarding perfect pairs of numbers, the definition of which changes in complexity with each task. Solutions require pupils to apply number sense and operations, as well...
Noyce Foundation
Fractured Numbers
Don't use use a fraction of the resource — use it all! Scholars attempt a set of five problem-of-the-month challenges on fractions. Levels A and B focus on creating fractions and equivalent fractions, while Levels C, D, and E touch on...
Noyce Foundation
Diminishing Return
Challenge individuals to compete as many tasks as possible. Lower-level tasks have pupils apply costs and rates to solve problems. Upper-level tasks add algebraic reasoning and conditional probability to the tasks.
Noyce Foundation
Double Down
Double the dog ears, double the fun. Five problems provide increasing challenges with non-linear growth. Topics include dog ears, family trees and population data, and geometric patterns.
Noyce Foundation
Lyle's Triangles
Try five problems on triangles. Levels A and B focus on shapes that can be created from right triangles. Level C touches upon the relationship between the area of a six-pointed star and the area of each triangle of which it is composed....
Noyce Foundation
Cubism
If cubism were a religion, would you follow it? Lower-level tasks focus primarily on counting the number cubes in a structure and relating the number to surface area. As learners progress to higher-level tasks, isometric drawings and...
Noyce Foundation
Through the Grapevine
Teach statistics by analyzing raisins. A thorough activity provides lesson resources for five levels to include all grades. Younger pupils work on counting and estimation, mid-level learners build on their understanding of the measures...
Noyce Foundation
Measuring Up
Teach the basics of measurement and conversion with a five-lesson resource that builds an understanding of proportion and measurement conversion from elementary through high school. Initially, young scholars use ratios to determine soup...
Noyce Foundation
Circular Reasoning
Examine the origin and application of pi in five different levels. The five lessons in the resource begin with an analysis of the relationship between the radius and circumference of a circle. The following lessons lead learners through...
Noyce Foundation
Movin 'n Groovin
Examine the consequences of varying speed. An engaging set of five problem sets challenges young mathematicians by targeting a different grade level from K-12. In the initial lesson, scholars make conclusions about the time it...
Noyce Foundation
First Rate
Explore distance and time factors to build an understanding of rates. A comprehensive set of problems target learners of all grade levels. The initial problem provides distance and time values and asks for the winner of a race. Another...
Noyce Foundation
Surrounded and Covered
What effect does changing the perimeter have on the area of a figure? The five problems in the resource explore this question at various grade levels. Elementary problems focus on the perimeter of rectangles and irregular figures with...
EngageNY
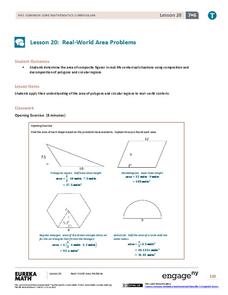
Real-World Area Problems
Not all structures take the shape of a polygon. The 21st lesson in a series of 29 shows young mathematicians they can create polygons out of composite shapes. Once they deconstruct the structures, they find the area of the composite figure.
EngageNY
Why Worry About Sampling Variability?
Are the means the same or not? Groups create samples from a bag of numbers and calculate the sample means. Using the sample means as an estimate for the population mean, scholars try to determine whether the difference is real or not.
EngageNY
Understanding Variability When Estimating a Population Proportion
Estimate the proportion in a population using sampling. The 20th installment in a series of 25 introduces how to determine proportions of categorical data within a population. Groups take random samples from a bag of cubes to determine...
EngageNY
Sampling Variability
Work it out — find the average time clients spend at a gym. Pupils use a table of random digits to collect a sample of times fitness buffs are working out. The scholars use their random sample to calculate an estimate of the mean of the...
EngageNY
Comparing Estimated Probabilities to Probabilities Predicted by a Model
Small groups devise a plan to find the bag that contains the larger percentage of blue chips. they then institute their plans and compare results to the actual quantities in the bags.
EngageNY
The Difference Between Theoretical Probabilities and Estimated Probabilities
Flip a coin to determine whether the probability of heads is one-half. Pupils use simulated data to find the experimental probability of flipping a coin. Participants compare the long run relative frequency with the known theoretical...
EngageNY
Chance Experiments
Class members are introduced to probability using terms such as impossible, unlikely, likely, and certain. Numbers between zero and one are associated with the descriptions of probability. Pupils find the likelihood of chance experiments...
EngageNY
Population Problems
Find the percent of the population that meets the criteria. The 17th segment of a 20-part unit presents problems that involve percents of a population. Pupils use tape diagrams to create equations to find the percents of subgroups...
EngageNY
Sampling Variability and the Effect of Sample Size
The 19th installment in a 25-part series builds upon the sampling from the previous unit and takes a larger sample. Pupils compare the dot plots of sample means using two different sample sizes to find which one has the better variability.
EngageNY
Conducting a Simulation to Estimate the Probability of an Event
How can you complete a simulation when it is not practical to determine the probability of an event? Class members learn that in some situations, it is not feasible to find the probability of an event, but they can estimate it by running...
EngageNY
Calculating Probabilities for Chance Experiments with Equally Likely Outcomes
Calculate theoretical probabilities and compare them to experimental probabilities. Pupils build on their knowledge of experimental probabilities to determine theoretical probabilities. Participants work several problems with the...
EngageNY
Estimating Probabilities by Collecting Data
Take a spin to determine experimental probability. Small groups spin a spinner and keep track of the sums of the spins and calculate the resulting probabilities. Pupils use simulated frequencies to practice finding other probabilities to...


