Mathematics Assessment Project
Shelves
Don't leave this task on the shelf — use it is assess middle schoolers understanding of patterns. Participants try to discover a pattern in the number of bricks and planks used to make shelves. They then match descriptions...
Mathematics Assessment Project
Octagon Tile
A connecting-the-dots activity seems too easy for seventh grade but connecting vertices may prove a challenge. Class members first examine a figure created by drawing squares around the inside of an octagon and connecting the...
Mathematics Assessment Project
Linear Graphs
A line is a line is a line. As a middle school assessment task, learners first identify graphs of given linear equations. They then identify the equations that represent real-world situations.
Mathematics Assessment Project
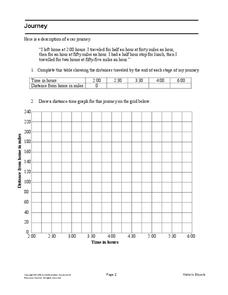
Journey
Drive home math concepts with an engaging task. Learners follow a verbal description to fill in a table and create a distance-time graph representing a car journey. They then answer questions by interpreting the graph.
Mathematics Assessment Project
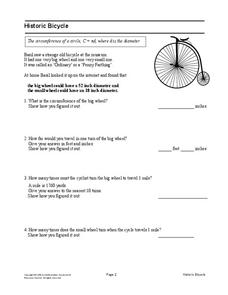
Historic Bicycle
"Ordinary" bicycles are not so ordinary. Learners use given information to determine the circumference of wheels for a historic Ordinary or Penny Farthing bicycle. Pupils then determine the number of times each wheel turns when the...
Mathematics Assessment Project
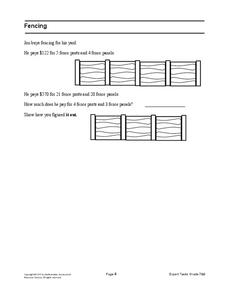
Fencing
Nail this assessment task to your list of resources. Learners must set up equations to model the cost of fencing that includes posts and panels. They then determine the cost of a fence with a specific number of posts and panels.
Mathematics Assessment Project
Buying Chips and Candy
As a middle school assessment task, learners first two write equations representing their purchase of chips and candy bars. They then solve the system of equations to find the price of each item.
Curated OER
Buses
Busy buses bustling back and forth. For this middle school assessment task, learners use information given in a graph to answer questions about bus schedules. They then determine how many times a bus passes by other buses going in the...
Mathematics Assessment Project
Aaron's Designs
Learners first create designs for greeting cards by applying transformations of shapes on a coordinate plane, and then determine a sequence of transformations that produces a given design.
Mathematics Assessment Project
Bike Ride
As a middle school assessment task, learners interpret the graph of distance versus time for a bike ride. Pupils then determine distance of the trip, length of the trip, and speeds.
Mathematics Assessment Project
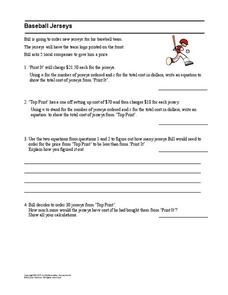
Baseball Jerseys
Batter up! As an assessment task, learners write linear functions to model the cost of baseball jerseys. They then determine which of two companies would charge a cheaper rate to buy baseball jerseys.
Mathematics Assessment Project
25% Sale
Free clothes? In the middle school assessment task, learners first consider whether four 25 percent reductions will result in a sale price of $0. Mathematicians then determine the sale price and discount percentage of such a sale.
Mathematics Assessment Project
Functions
Studying function means more than simply learning a formula. Learners must use functions to think through four problems and find solutions. Each task utilizes a different concept from a study of functions. Class members might...
Mathematics Assessment Project
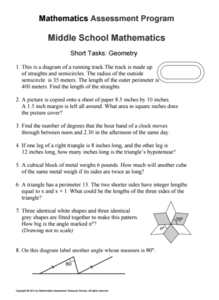
Geometry
Help learners find joy in facing mathematical challenges. The questions posed on this worksheet encourage young mathematicians to utilize skills learned throughout a geometry unit, and to apply themselves and persevere through...
EngageNY
Ruling Out Chance (part 2)
Help your classes find the significance in this lesson! Learners analyze the probability of Diff values. They then determine if the difference is significant based on their probability of occurrence.
EngageNY
Differences Due to Random Assignment Alone
It takes a lot of planning to achieve a random result! Learners compare results of random assignment, and conclude that random assignment allows results to be attributed to chance. They also realize the set of random means...
EngageNY
Margin of Error When Estimating a Population Proportion (part 2)
Error does not mean something went wrong! Learners complete a problem from beginning to end using concepts developed throughout the last five lessons. They begin with a set of data, determine a population proportion, analyze their result...
EngageNY
Margin of Error When Estimating a Population Proportion (part 1)
Use the power of mathematics to find the number of red chips in a bag — it's a little like magic! The activity asks learners to collect data to determine the percentage of red chips in a bag. They calculate the margin of error and...
EngageNY
Sampling Variability in the Sample Proportion (part 1)
Increase your sample and increase your accuracy! Scholars complete an activity that compares sample size to variability in results. Learners realize that the greater the sample size, the smaller the range in the distribution of sample...
EngageNY
Types of Statistical Studies
All data is not created equal. Scholars examine the different types of studies and learn about the importance of randomization. They explore the meaning of causation and when it can be applied to data.
EngageNY
Distributions—Center, Shape, and Spread
Data starts to tell a story when it takes shape. Learners describe skewed and symmetric data. They then use the graphs to estimate mean and standard deviation.
EngageNY
Events and Venn Diagrams
Time for statistics and learning to overlap! Learners examine Venn Diagrams as a means to organize data. They then use the diagrams to calculate simple and compound probabilities.
EngageNY
Calculating Conditional Probabilities and Evaluating Independence Using Two-Way Tables (part 2)
Without data, all you are is another person with an opinion. Show learners the power of statistics and probability in making conclusions and predictions. Using two-way frequency tables, learners determine independence by analyzing...
EngageNY
Calculating Conditional Probabilities and Evaluating Independence Using Two-Way Tables (part 1)
Being a statistician means never having to say you're certain! Learners develop two-way frequency tables and calculate conditional and independent probabilities. They understand probability as a method of making a prediction.


