EngageNY
Horizontal and Vertical Asymptotes of Graphs of Rational Functions
Get close to your favorite line. Scholars use end behavior to help find horizontal asymptotes. With the understanding of domains of rational functions, learners find vertical asymptotes and then use graphing calculators to verify the...
Teach Engineering
Nanotechnology in Action: Organic Electronics
Even electronics are going organic. Future engineers learn about organic fibers and their uses in electronics and textiles. Specifically, they study graphene and its properties by creating graphite-based fibers in a laboratory setting...
EngageNY
Inverse Functions
Undo the functions. Learners refresh their knowledge of inverses of functions from Algebra II in the 19th section of a 23-part Precalculus unit. Pupils look at inverses in tables and graphs. They then add to their understanding of...
EngageNY
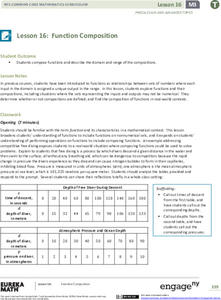
Function Composition
Combine functions for the first time. Pupils investigate composition of functions using a function table and then function machines in the 17th installment in a 23-part Precalculus series. Scholars learn the two notations for composition...
EngageNY
Curves from Geometry
Escape to investigate hyperbolas. Pupils take a look at what happens to the elliptical orbital path of a satellite that exceeds escape velocity as the opener to the eighth lesson in a unit of 23. Scholars analyze basic hyperbolas and how...
EngageNY
The Binomial Theorem
Investigate patterns in the binomial theorem. Pupils begin by reviewing the coefficients from Pascal's triangle. They look at the individual terms, the sums of the coefficients on a row, and the alternating sum of each row. Individuals...
EngageNY
Inverses of Logarithmic and Exponential Functions
Revisit the relationship between logarithms and exponentials. Learners review the notion of logarithms as the way to solve exponential equations in the 21st segment in a Pre-calculus series of 23. Pupils use the knowledge to prove that...
EngageNY
Curves from Geometry
Take a another look at ellipses. The seventh segment in a series of 23 in a Precalculus module continues to investigate the graph and equation of an ellipse from the previous instructional activity. Scholars investigate the fact that the...
Koshland Science Museum
Infectious Disease: Evolving Challenges to Human Health Middle School Virtual Field Trip
Is there one right way to control infectious diseases? Learners determine the facts each stakeholder must consider when making their recommendations for controlling a disease threatening their area. They take into account public health,...
National Academy of Sciences
Genetic Disease: Putting DNA to Work
Scientific knowledge of genetic information has grown quickly over the last decade. An interactive lesson has learners research the role of science and medicine in diagnosing and treating genetic disorders. They consider the job of the...
US Department of Commerce
The New Normal
Don't be normal ... be exceptional in understanding statistics. Pupils analyze six different sets of census data using histograms or normal probability plots to determine whether each data set fits a normal distribution. They then get...
US Department of Commerce
Over the Hill - Aging on a Normal Curve
Nobody is too old to learn something new. Young statisticians analyze census data on the percentage of the population older than 65 years old in US counties. They fit a normal distribution to the data, determine the mean and standard...
Koshland Science Museum
Infectious Disease: Evolving Challenges to Human Health High School Virtual Field Trip
Understanding the science of the spread of infectious diseases is the first step in controlling them. Learners begin by researching the factors that affect the contraction and spread of these diseases and the challenges communities face...
National Academy of Sciences
Lights at Night Webquest
Help learners find ways to become more efficient energy consumers. To start, individuals research how different countries address energy efficiency and then analyze their own carbon footprint. They use their research to identify ways to...
National Academy of Sciences
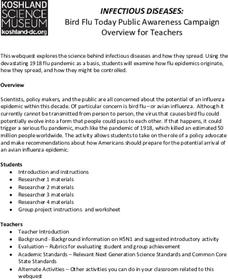
Infectious Diseases: Bird Flu Today
Understanding how viruses spread has never been more important. A well-designed WebQuest lesson has young scientists research viruses, how they spread, and how they are treated. They also consider the trends in common viruses in the world.
Corbett Maths
Mixed Numbers to Improper Fractions
Mix things up a little to be improper. The presenter shows three example of changing a mixed number to an equivalent improper fraction. Scholars work several practice problems and application questions to refine the process.
Corbett Maths
Improper Fractions to Mixed Numbers
What's the proper way to convert fractions? A short video shows three quick examples of converting an improper fraction to a mixed number. Pupils practice doing their own conversions to better understand the skill.
Corbett Maths
Multiplying Fractions
Multiply straight across. A video shows straightforward examples of multiplying fractions by multiplying the numerators and the denominators. Pupils practice the skill and give their answers as simplified fractions.
New Mexico State University
Agrinautica
Individuals play a computer game to terraform planets. Learners add plants, animals, fungi, and minerals to the planet surface by creating numerical expressions that represent the objects. After playing the game for a while, the class...
US Department of Commerce
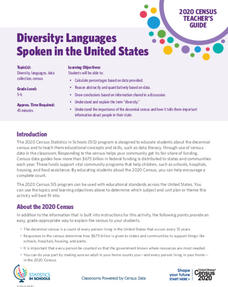
Diversity: Languages Spoken in the United States
High schoolers begin a discussion on diversity and determine the percent of the population that speak another language at home in the US. Classmates make a prediction of the percentage of people that speak another language at home in...
US Department of Commerce
How Does Our Class Compare?
Compare the class to the country. As a group, pupils collect data on the types of activities boys and girls do after school. Learners compare the number of girls to the number of boys for each activity. Using census data, individuals...
US Department of Commerce
Commuting to Work: Box Plots, Central Tendency, Outliers
Biking may be an outlier. Using data from 10 states on the number of people reporting they bike to work, pupils calculate the measures of center. Scholars determine the range and interquartile range and find which provides a better...
US Department of Commerce
Census in Counties - Describing and Comparing Histograms to Understand American Life
Use graphs to interpret life in 136 counties. Pupils analyze histograms and describe the shapes of the distributions of data collected from several counties on different aspects of life. Scholars make predictions on the difference in...
US Department of Commerce
Creating and Taking a Survey
Individuals learn how to conduct surveys and collect data for the class on age, pets, and number of people at home. Scholars compare their household size to the information in the census. Pupils then develop additional questions to ask...


