PBL Pathways
Death Project
Verify the rule of thumb for finding the time of death. The project-based learning task asks pupils to determine when the rule of thumb process of finding the time of death is appropriate. Learners develop a function for the rule and...
PBL Pathways
Biscuits
Calculate the nutrients in different types of dog biscuits. Pupils create a technical report outlining the amount of calcium, protein, and carbohydrates in three types of dog biscuits. The project-based learning activity requires...
Virginia Department of Education
Permutations and Combinations
Counting is not all it adds up to be — sometimes it involves multiplying. The lesson introduces permutations and combinations as ways of counting, depending upon whether order is important. Pupils learn about factorials and the formulas...
Virginia Department of Education
Line of Best Fit
Pupils work through a guided activity on fitting a linear equation to a set of data by entering the data into a calculator and trying to envision a line of best fit. They then have the calculator determine the least-squares line and...
Virginia Department of Education
Organizing Topic: Data Analysis
Learners engage in six activities to lead them through the process of conducting a thorough analysis of data. Pupils work with calculating standard deviations and z-scores, finding the area under a normal curve, and sampling techniques....
Virginia Department of Education
Linear Curve of Best Fit
Is foot length to forearm length a linear association? The class collects data of fellow scholars' foot length and the length of their forearms. They plot the data and find a line of best fit. Using that line, they make predictions of...
Virginia Department of Education
The Pythagorean Relationship
Add up areas of squares to discover the pythagorean relationship. Small groups create right triangles with squares along each side. They calculate the areas of each square and notice the relationship. Groups construct other types of...
EngageNY
Conducting a Simulation to Estimate the Probability of an Event
How can you complete a simulation when it is not practical to determine the probability of an event? Class members learn that in some situations, it is not feasible to find the probability of an event, but they can estimate it by running...
EngageNY
Calculating Probabilities of Compound Events
Use tree diagrams with multiple branches to calculate the probabilities of compound events. Pupils use tree diagrams to find the sample space for probability problems and use them to determine the probability of compound events in the...
Virginia Department of Education
Box-and-Whisker Plots
The teacher demonstrates how to use a graphing calculator to create box-and-whisker plots and identify critical points. Small groups then create their own plots and analyze them and finish by comparing different sets of data using box...
Virginia Department of Education
Curve of Best Fit
Which function models the data best? Pupils work through several activities to model data with a variety of functions. Individuals begin by reviewing the shapes of the functions and finding functions that will fit plotted data points. By...
Virginia Department of Education
Congruent Triangles
Is this enough to show the two triangles are congruent? Small groups work through different combinations of constructing triangles from congruent parts to determine which combinations create only congruent triangles. Participants use the...
Virginia Department of Education
Transformations
The coordinate plane is a popular place! Identify rotations, reflections, and dilations on the coordinate plane. Pupils work in small groups to match transformations of a figure with the description of the transformation. They perform...
02 x 02 Worksheets
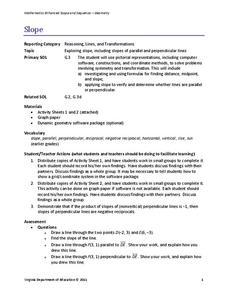
Slope
What does slope have to do with lines? Pupils work with lines and determine the slope of the lines informally and with the slope formula. Groups use their knowledge to calculate the slopes of parallel and perpendicular lines. They also...
Virginia Department of Education
Lines and Angles
Explore angle relationships associated with transversals. Pupils construct parallel lines with a transversal and find the measures of the angles formed. They figure out how the different angles are related before constructing...
Virginia Department of Education
Quadratic Curve of Best Fit
Class members create a table of the number of chords that can be drawn given the number of points on a circle. Pupils analyze the data created, find a function to fit to it, and use the function to make further predictions.
Virginia Department of Education
Normal Distributions
Pupils work to find probabilities by using areas under the normal curve. Groups work to calculate z-scores and solve real-world problems using the empirical rule or tables.
Virginia Department of Education
Surface Area and Volume
Partners use materials to wrap three-dimensional objects to determine the formula for surface area. The groups use an orange to calculate the amount of peel it takes to completely cover the fruit. Using manipulatives, individuals then...
Virginia Department of Education
Constructions
Pupils learn the steps for basic constructions using a straightedge, a compass, and a pencil. Pairs develop the skills to copy a segment and an angle, bisect a segment and an angle, and construct parallel and perpendicular lines.
Virginia Department of Education
Distance and Midpoint Formulas
Small groups work through two guided activities to derive the distance and midpoint formulas for the coordinate plane. The activities begin with concrete examples and move to abstract.
National Institute of Food and Agriculture
Water Supply
Participate in three activities that look at the earth's limited water supply and the changes water goes through as it enters each phase of the water cycle. The resource is complete with three activities that demonstrate the changing...
American Statistical Association
How Tall and How Many?
Is there a relationship between height and the number of siblings? Classmates collect data on their heights and numbers of brothers and sisters. They apply statistical methods to determine if such a relationship exists.
American Statistical Association
You and Michael
Investigate the relationship between height and arm span. Young statisticians measure the heights and arm spans of each class member and create a scatter plot using the data. They draw a line of best fit and use its slope to explain the...
Point Pleasant Beach School District
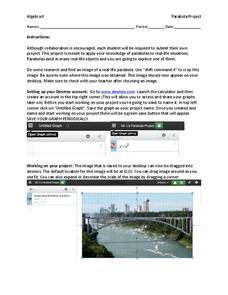
Parabola Project
Class members select a picture that contains a parabola and construct a drawing of it using function graphs in the quadratic project. Individuals restrict the domains of the functions to create a more accurate drawing. They then submit a...


