Khan Academy
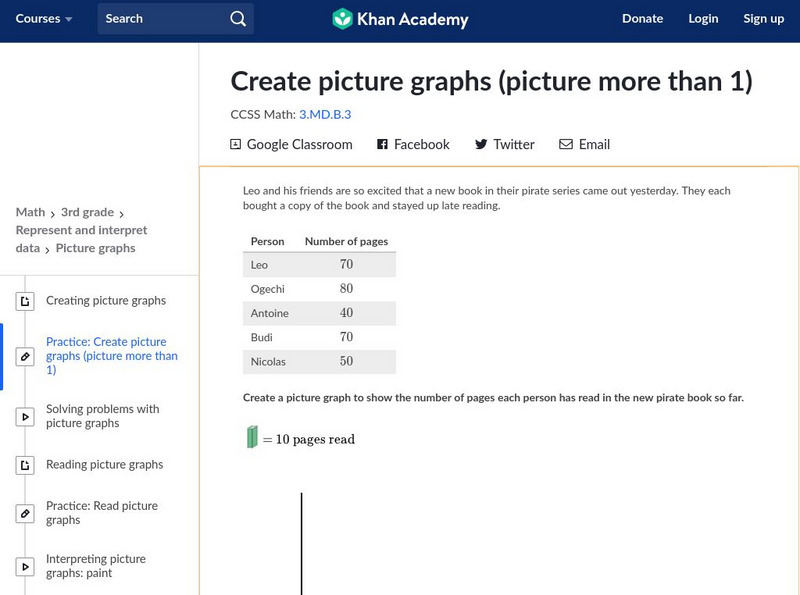
Khan Academy: Create Picture Graphs (Picture More Than 1)
Create and interpret picture graphs. Students receive immediate feedback and have the opportunity to try questions repeatedly, watch a video tutorial, or receive hints about how to create picture graphs. CCSS.Math.Content.3.MD.B.3 Draw a...
Alabama Learning Exchange
Alex: "Bursting With Math"
Using "Starburst" jelly beans to sort, graph and add.
Alabama Learning Exchange
Alex: You Scream, I Scream, We All Scream for Ice Cream !
Fun and yummy lesson to do on a sunny spring afternoon. Have the students take a poll of their favorite choice of ice cream and create a bar graph showing the information. This lesson plan was created as a result of the Girls Engaged in...
Alabama Learning Exchange
Alex: What's in a Name: Graphing Lesson
A lesson that teaches students how to create and analyze a graph using the letters of their name. The lesson uses the book Chrysanthemum by Kevin Henkes (not included in the lesson plan) to start the discussion.
Better Lesson
Better Lesson: Graphing Our Snack Mix: Review of Graphing
Second graders review how to make bar graphs, line plots, and pictographs by tallying the contents of snack mix and building graphs to show their data.
Better Lesson
Better Lesson: Going for the Gold
Second graders read and create graphs based on Olympic data for 2014.
Better Lesson
Better Lesson: Graphing Data on a Graph
Second graders will be able to read and write data on a graph.
Better Lesson
Better Lesson: Math Hunt Part 2
SWBAT take the data from class and home and create comparisons of the different ways math is used by adults.
Better Lesson
Better Lesson: Building Our Own Bar Graphs (Part I)
Second graders use data to create a tally chart and make a bar graph. This instructional activity includes a detailed plan, videos of students engaged in the instructional activity, and printable worksheets.
Better Lesson
Better Lesson: Class Surveys and Graphs
Students love graphing data that they "own". In this plan, the class will select a type of graph and create it using a class survey frequency table. Included in this activity are videos of the class engaged in the activity and samples of...
Better Lesson
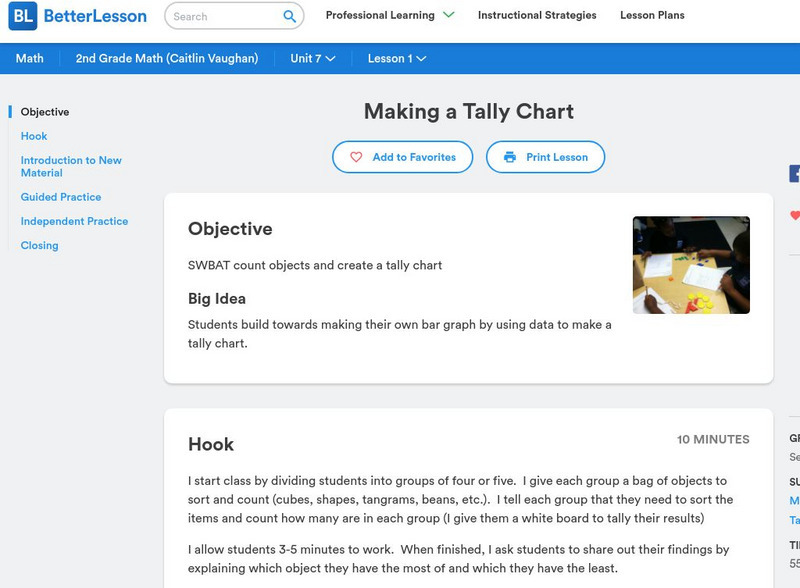
Better Lesson: Making a Tally Chart
Second graders build towards making their own bar graph by using data to make a tally chart.
Better Lesson
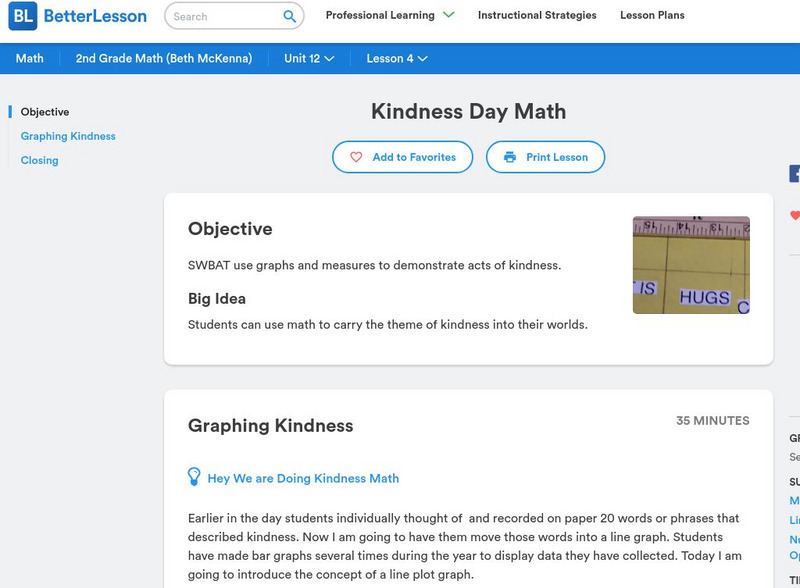
Better Lesson: Kindness Day Math
Second graders can use graphs to carry the theme of kindness into their worlds.
ABCya
Ab Cya: Fuzz Bugs Patterns
Creating and interpreting a bar graph has never been so much fun! In this educational game kids will create a bar graph by sorting the Fuzz Bugs. Patterns start off easy and get progressively more difficult.
Better Lesson
Better Lesson: Pets, Pets and More Pets
Second graders love to talk about pets and in this lesson they can share how many pets they have.
Better Lesson
Better Lesson: Writing and Solving Number Stories
We can apply math to almost every part of the day and make math have a purpose for students.
Better Lesson
Better Lesson: Patterns in Nature
Are there patterns in nature that can be described by numbers? That is what we will find out here.
Better Lesson
Better Lesson: Using a Pattern to Solve a Problem
Patterns are prevalent in all levels of math. Common Core Standards expect students to be able to use structure - like that found in repeating the patterns of odd and even numbers or counting by 5s or 10s - to solve problems (MP7).
Better Lesson
Better Lesson: Terry's Taco Shack: What Does "How Many More" Mean?
Second graders oftentimes struggle with comparison problems since there is no "action" in the problem (i.e.: nothing is getting taken away or added). For this lesson, 2nd graders practice strategies for solving comparison problems.
Better Lesson
Better Lesson: Dr. Suess Graphs and Mountains
Climbing a mountain, you reach the greatest height at the top. What about a math mountain? The graphic can help students solve for a missing number.
Better Lesson
Better Lesson: Dr. Seuss Graphs Part 1
Favorite Dr. Seuss characters are something that students can collect data on, graph and interpret.
Other
Nearpod: Reading Picture & Bar Graphs
In this lesson plan on picture graphs and bar graphs, 2nd graders learn key vocabulary, draw the graphs, and compare the graphs.
ClassFlow
Class Flow: Picture Graphs
[Free Registration/Login Required] This flipchart has the definition of a picture graph. It is designed for students to use various picture graphs to solve math problems. There are even picture graphs made with no questions - leaving it...
ClassFlow
Class Flow: Ice Cream Bar Graph
[Free Registration/Login Required] This flipchart reviews bar graphs, how to create them and read them. Excellent activity to get your students involved in a tasty math activity!
ClassFlow
Class Flow: Witches Brew
[Free Registration/Login Required] This flipchart concentrates on subtraction but uses a wide variety of teaching strategies to help students understand subtraction. The clever theme keeps their attention and problems are stated in...


