Shodor Education Foundation
Shodor Interactivate: Scatter Plot
Graph ordered pairs and customize the graph title and axis labels. Points are connected from left to right, rather than being connected in the order they are entered.
Better Lesson
Better Lesson: Graphing Using a Frequency Table
Multiple graphs can represent the same data set and make the information easier to understand.
National Council of Teachers of Mathematics
Nctm: Illuminations: State Names
Students use multiple representations to display how many times the letters of the alphabet is used in a state name. Concepts explored: stem and leaf, box and whisker plots, histograms.
Louisiana Department of Education
Louisiana Doe: Louisiana Believes: Eureka Math Parent Guide: Collecting and Displaying Data
A guide to support parents as they work with their students in collecting and displaying data.
E-learning for Kids
E Learning for Kids: Math: Pizza (Italian) Restaurant: Data and Chance
In this interactive site, students practice with bar and picture graphs by helping a pizza place collect and analyze their data.
National Council of Teachers of Mathematics
Nctm: Illuminations: Bar Grapher
A computer applet that will draw any bar graph with student's data input.
Scholastic
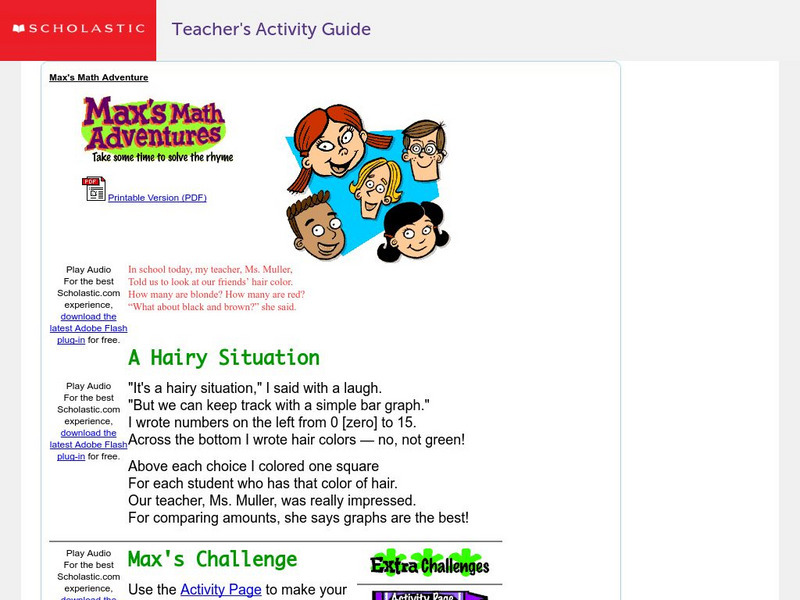
Scholastic: Max's Math Adventures: A Hairy Situation
Help Max make a bar graph to show the hair colors of his classmates. Teachers will appreciate the activities with bar graphs in the extra challenges. Use the teacher's guide to create a fun and engaging lesson.
The Math League
The Math League: Using Data and Statistics
This site contains two short examples of line graphs, charts that show change over time. This is a quick introduction to the topic of statistical graphing.
The Math League
The Math League: Using Data and Statistics: Pie Charts
This introductory tutorial about statistical graphing with four examples of how pie charts (circle graphs) are constructed and read.
ClassFlow
Class Flow: Picture Graphs
[Free Registration/Login Required] This flipchart has the definition of a picture graph. It is designed for students to use various picture graphs to solve math problems. There are even picture graphs made with no questions - leaving it...
ClassFlow
Class Flow: Thanksgiving Graphing
[Free Registration/Login Required] Students will interpret data from a bar graph and a pictograph. They will then create one of each on the Activboard. This flipchart includes links to websites and an Activote quiz.
Varsity Tutors
Varsity Tutors: Hotmath: Algebra Review: Bar Graph
Find a quick, concise explanation of a bar graph. An example is given.
ClassFlow
Class Flow: Using Graphs
[Free Registration/Login Required] This flipchart contains a variety of graphs with internet links which can be beneficial to Science Project planning.
ClassFlow
Class Flow: Explore a Pictograph
[Free Registration/Login Required] Use this flipchart to explore a pictograph. Create a pictograph and use the key of the graph to answer questions.
ClassFlow
Class Flow: Graphing
[Free Registration/Login Required] Students will identify pictographs, bar graphs and circle graphs.
ClassFlow
Class Flow: Graphing Graphs
[Free Registration/Login Required] Standard: Constructs and Interprets simple bar graphs and pictographs with up to 5 columns using whole unit data.
ClassFlow
Class Flow: Graphing Lists Tables
[Free Registration/Login Required] This lesson plan flipchart provides opportunities for interpreting information in simple tables and graphs.
ClassFlow
Class Flow: Graphs
[Free Registration/Login Required] This flipchart presents bar and double bar graphs, line and double line graphs, pictographs, histograms, and circle graphs with review activities and web links for practice.
ClassFlow
Class Flow: Let's Graph It!
[Free Registration/Login Required] This flipchart has a week of mini lessons where students create bar graphs and pictographs. Students will collect data using tally marks and analyze graphs with discussion questions. Activotes are used...
Math Is Fun
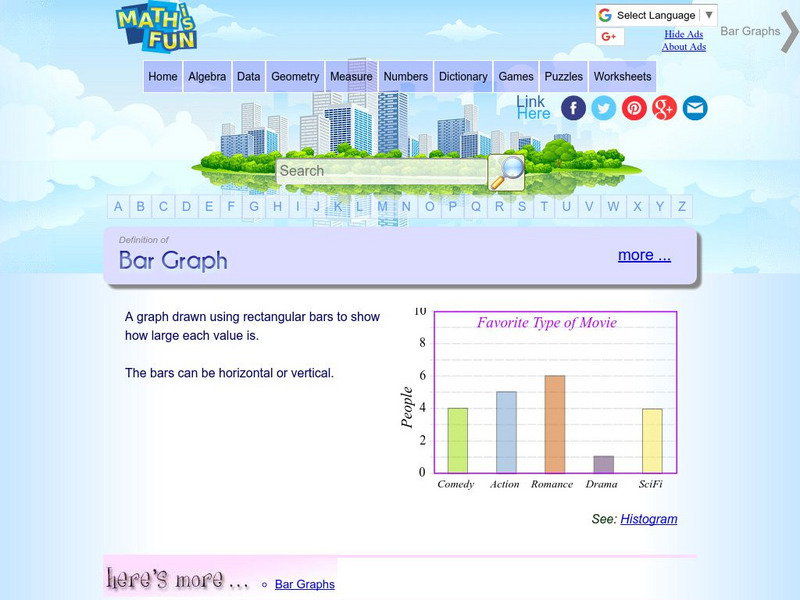
Math Is Fun: Definition of Bar Graph
Get the definition for a bar graph. Then, select the link "here's more" and use the interactive graph to display data as a bar graph, line graph or pie chart. The finished graph may be printed.
University of Cambridge
University of Cambridge: Nrich: The Pet Graph
On this one-page website, sharpen your logic and graph reading skills by figuring out which pet goes with each bar on the graph. The solution is available to double check your own solution.
That Quiz
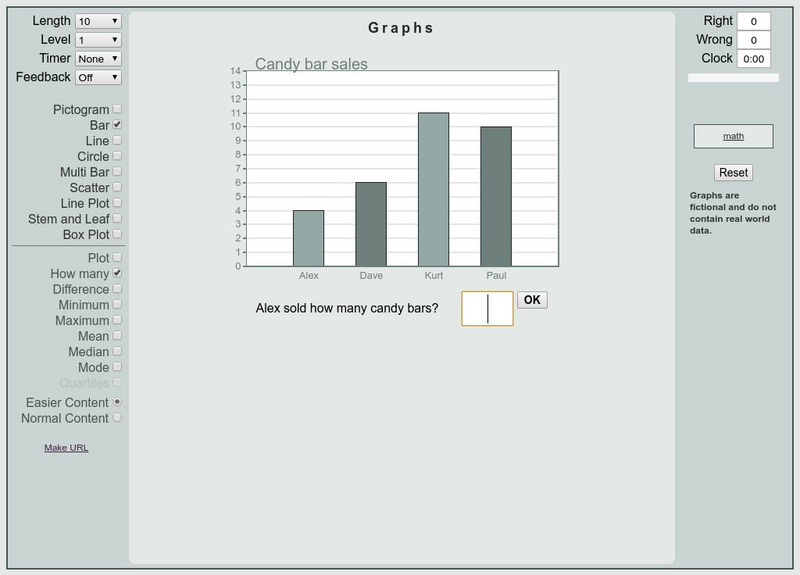
That Quiz: Graficas
This is an interactive practice to review bar graphs, circle graph, scatter plot, etc. Test are timed and keep track of right and wrong answers. Different levels of difficulties are provided.
Education Place
Houghton Mifflin: Eduplace: Make a Living Bar Graph
Student use simple data to line up in a living bar graph activity when they respond to simple questions in this lesson plan. They physically and visually represent the data. CCSS.Math.Content.3.MD.B.3 Draw a scaled picture graph and a...


