Curated by
ACT
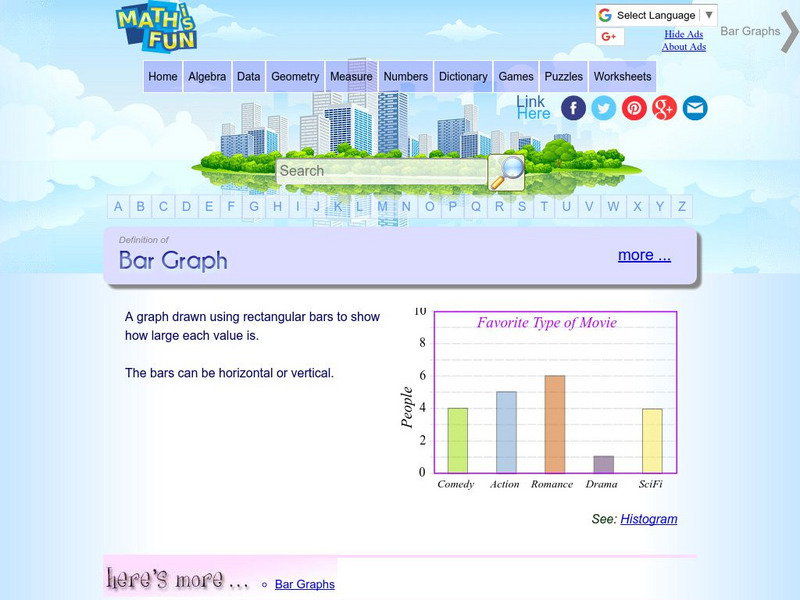
Get the definition for a bar graph. Then, select the link "here's more" and use the interactive graph to display data as a bar graph, line graph or pie chart. The finished graph may be printed.
3 Views
1 Download
CCSS:
Adaptable
Concepts
Additional Tags
Classroom Considerations
- Knovation Readability Score: 2 (1 low difficulty, 5 high difficulty)

