Curated OER
School Activities
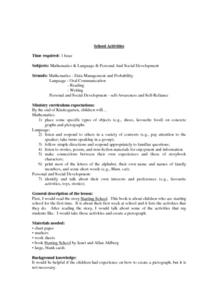
First graders place some specific types of objects (e.g., shoes, favorite food) on concrete graphs and pictographs. They listen and respond to others in a variety of contexts (e.g., pay attention to the speaker; take turns speaking in a...
Curated OER
Lessons for Atlatl Users with Some Experience-Grade 5
Fifth graders throw darts, collecting data for distance traveled. In this data analysis lesson, 5th graders throw a dart using an atlatl. They calculate the speed for each throw and determine the best dart length for distance throws.
Curated OER
The Perfect Principal
Students demonstrate their understanding of math skills. In this data analysis lesson, students complete a worksheet requiring them to calculate mean, median, and mode, and create and interpret graphs. Lesson is intended as an assessment...
Curated OER
Remembering Our Veterans
Eighth graders research a variety of military statistics while using the theme of Remebering Our Veterans. They use data management to plan and create a PowerPoint presentation with their findings. They incorporate different types of...
Curated OER
Remembering Our Veterans Data Management Project
Seventh graders utilize data collected from various sources based on Canadian military statistics to consolidate their understanding of data management. Students plan and create a PowerPoint presentation using this data including in...
Shodor Education Foundation
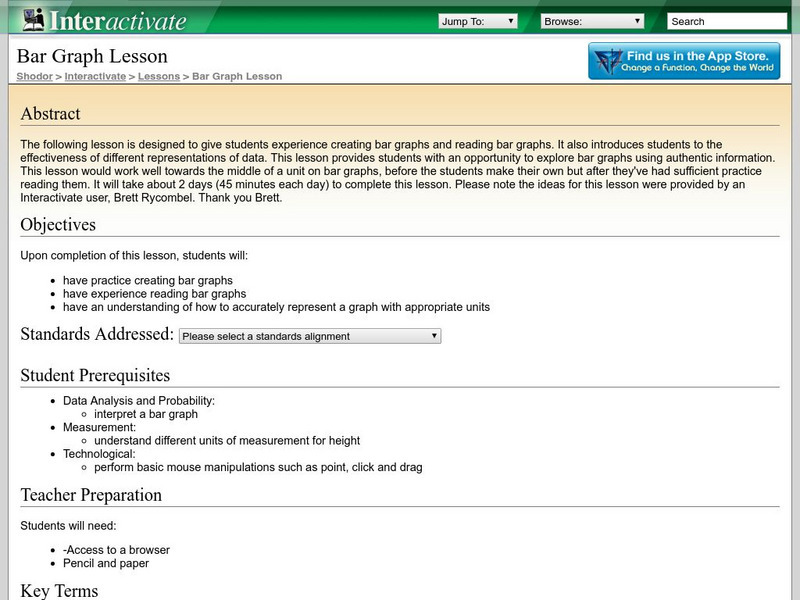
Shodor Interactivate: Lesson: Bar Graph
This lesson is designed to give students practice creating and reading bar graphs as well as understanding how to accurately represent a graph with appropriate units.
Other
Ns Dept. Of Education: Grades 9 12 Atlantic Canada Data Management [Pdf]
Statistics Canada prepared this document for use by teachers in Atlantic Canada. It lists lesson resources on the StatsCan website for data management, statistics and probability in the secondary curriculum.
Other
Ns Dept. Of Education: Mathematics: Grade 9: Data Management Using E Stat [Pdf]
This 70-page teaching unit utilizes the resources on the Statistics Canada website for activities designed for Grade 9.
Teachnology
Teachnology: Survey Teaching Theme
Survey Theme provides an excellent collection of free sample worksheets, teacher resources, lesson plans and interactive media for grades k-12.
Teachnology
Teachnology: Survey Teaching Theme
Survey Theme provides an excellent collection of free sample worksheets, teacher resources, lesson plans and interactive media for grades k-12.
That Quiz
That Quiz: Practice Test: Graphs
This resource allows users to test their knowledge of graphs and graphing methods.
Other
Mr Barton Maths: The Maths E Book of Notes and Examples [Pdf]
A 374-page colorfully illustrated e-book on topics in four categories: Number; Algebra; Shape, Space, and Measure; and Data Handling and Probability. The presentation is similar to what you would find in a Math dictionary.
Other
Unisys
Learn all you need to know about Unisys at this site. You can get the latest news about the company, find out about career opportunities, learn about their services, software, and hardware available, and a lot more.
Other
Link to Learning: Data Management and Probability
Link to Learning is a site popular among Ontario teachers. This collection of sites addresses Data Management and Probability expectations in the Ontario Math curriculum for Kindergarten to Grade 8.
Other
Link to Learning: Data Management and Probability
Link to Learning is a site popular among Ontario teachers. This collection of sites addresses Data Management and Probability expectations in the Ontario Math curriculum for Kindergarten to Grade 8.
Math Is Fun
Math Is Fun: Definition of Bar Graph
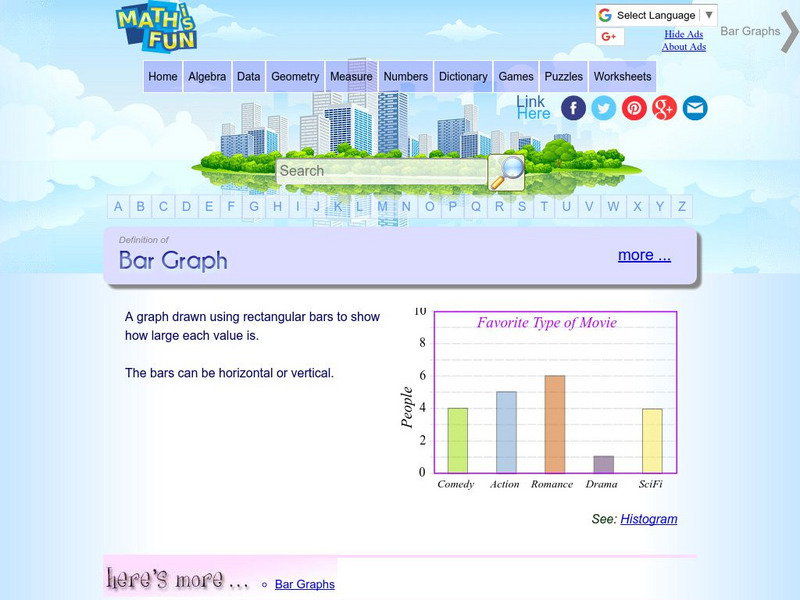
Get the definition for a bar graph. Then, select the link "here's more" and use the interactive graph to display data as a bar graph, line graph or pie chart. The finished graph may be printed.
Teachnology
Teachnology: Teacher Guide to Probability and Statistics
Statistics Theme provides a collection of free sample worksheets, teacher resources, lesson plans and interactive media for grades k-12.




![Ns Dept. Of Education: Grades 9 12 Atlantic Canada Data Management [Pdf] Lesson Plan Ns Dept. Of Education: Grades 9 12 Atlantic Canada Data Management [Pdf] Lesson Plan](https://d15y2dacu3jp90.cloudfront.net/images/attachment_defaults/resource/large/FPO-knovation.png)
