Curated OER
“I Can” Common Core! 6th Grade Math
Help your sixth graders reach their Common Core math standards by providing them with a checklist of "I can" statements for each standard. As each concept is covered, kids can check it off, as long as they can do what it states.
Mathematics Assessment Project
Mean, Median, Mode, and Range
What a find! Here is a lesson, designed to meet sixth grade math Common Core standards, that focuses on the calculation of different measures of center for the scores from a penalty shoot-out competition. An independent...
American Statistical Association
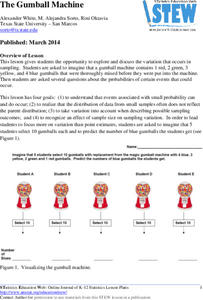
The Gumball Machine
Chew on an activity for probability. Given information on the number of gumballs in a gumball machine, scholars consider how likely it is to randomly draw a blue gumball and how many of each color they would draw in 10 trials if the...
Workforce Solutions
Miniature Gulf Coast Project
Scholars show what they know about data collection and analysis with an activity that examines a smaller population of Houghton, Texas. Independently or in pairs, learners identify their research question, gather, graph, and analyze...
Utah Education Network (UEN)
Statistics
Find the value in analyzing data values. Statistics is the focus in the fifth of seven installments of the 6th Grade Math series. Individuals learn to examine dot plots, histograms, and box plots by considering the shape, mean, median,...
Teach Engineering
Exploring Variables While Testing and Improving Mint-Mobiles (for Middle School)
There are more ways to use mint candies than to just eat them. In groups, learners design and build race cars using mint candies, drinking straws, Popsicle sticks, index cards, and other materials. They decide on an independent variable...
PBS
The Lowdown — Examining California's Prison System: Real-World Ratio
Free yourself from the shackles of traditional math lessons. Young mathematicians investigate race, gender, and age differences in California's prison system. They use provided graphics to compare the prison population with the state's...
American Statistical Association
Tell it Like it is!
Scholars apply prior knowledge of statistics to write a conclusion. They summarize using correct academic language and tell the story of the data.
Teach Engineering
Balsa Glider Competition
Change one variable and try again. Teams build basic balsa gliders and collect data on their flight distances and times. Through collaboration, the team decides on two modifications to make to the basic design and collect data for the...
CK-12 Foundation
Mode: Kittens
It is not as difficult as herding cats. The short interactive provides a group of kittens to sort according to their colors. Pupils determine the mode of the number of kittens by color. The questions continue with other numbers of...
CK-12 Foundation
Mode: Mucho Money
Generate stacks of money. Given bills of different denominations, pupils stack them based on their values. The learners figure out which value is the mode of the data and determine whether the data is unimodal, bimodal, or multimodal.
CK-12 Foundation
Mode: Boxes of Oranges
See how your data stacks up. Pupils stack crates of oranges in increasing order, creating a simple bar graph. Using the graph, individuals determine measures of center and describe the shape of the distribution. Scholars determine what...
CK-12 Foundation
Mean: Harmonic Mean
Let the means live in harmony. With lengths representing the values of a small data set, learners compare the arithmetic mean to the harmonic mean. The pupils determine which value is the most accurate representation of the average of...
CK-12 Foundation
Mean: Arithmetic Mean
How is a mean affected by changes in data? A well-designed animation allows individuals to manipulate data and watch the effect on the mean. Challenge questions help guide users to conclusions about outliers and skew within data.
Noyce Foundation
Through the Grapevine
Teach statistics by analyzing raisins. A thorough activity provides lesson resources for five levels to include all grades. Younger pupils work on counting and estimation, mid-level learners build on their understanding of the measures...
Teach Engineering
Air Pollution in the Pacific Northwest
Scholars investigate levels of nitrogen dioxide in the Pacific Northwest by examining the role of nitrogen in air pollution and how remote sensing can be used to measure nitrogen levels. An Excel spreadsheet calculates the difference...
Los Angeles County Office of Education
Assessment For The California Mathematics Standards Grade 6
Test your scholars' knowledge of a multitude of concepts with an assessment aligned to the California math standards. Using the exam, class members show what they know about the four operations, positive and negative numbers, statistics...
Laying the Foundation
Box-and-Whisker Plots
Statistics is made approachable, and dare we say fun, in this activity on using box-and-whisker plots to analyze and compare data sets. Specific emphasis is placed on interpretations and explanations while graphing, and in using the...
Alabama Learning Exchange
The Mean, Median, and Mode Chain Gang
Young scholars analyze a set of data. They work in cooperative groups and use chain links to identify the mean, median, and mode of the chain.
Google
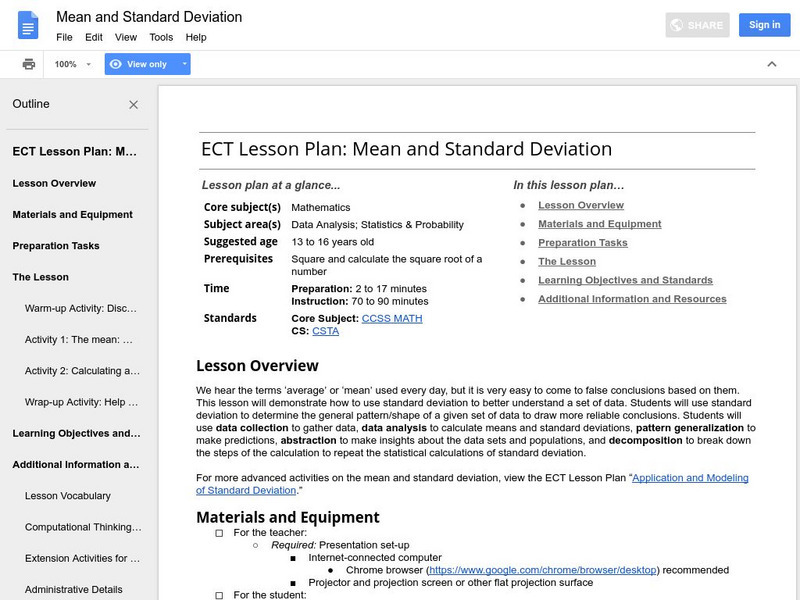
Google for Education: Mean and Standard Deviation
This lesson demonstrates to young scholars how to use standard deviation to better understand a set of data. Students use standard deviation to determine the general pattern or shape of a given set of data to draw more reliable conclusions.
BBC
Bbc: Ks2 Bitesize: Maths: Handling Data
This site provides games, quizes, and information about handling data, including mode, median, and mean.
Education Development Center
Math Partners: Statistics and Probability [Pdf]
Comprehensive unit that consists of lessons and activities designed to help students learn statistics and probability concepts.
Math Drills
Math Drills: Statistics and Probability Worksheets
Download these free worksheets to sharpen your skills with statistics and probability. Sheets focus on collecting and organizing data, measures of central tendency (mean, median, mode, and range), and probability.
Cuemath
Cuemath: Mean, Median and Mode
A comprehensive guide for learning all about mean, median, and mode with definitions, the relation between them, solved examples, and practice questions.


![Math Partners: Statistics and Probability [Pdf] Unit Plan Math Partners: Statistics and Probability [Pdf] Unit Plan](https://d15y2dacu3jp90.cloudfront.net/images/attachment_defaults/resource/large/FPO-knovation.png)