Texas Instruments
Texas Instruments: Scatter Plots
Basic activity of collecting data and graphing sets of data to see if there is a relationship.
Texas Instruments
Texas Instruments: Birthday Scatter Plot
Students will be able to interpret a scatter plot to see if there is a relationship between the two variables.
Texas Instruments
Texas Instruments: Burning Volumes
An analysis of how the volume of various jars impacts the burning time of candles. Data collected will be used to explore modeling, line fitting and linear regression Using graphing calculators.
Texas Instruments
Texas Instruments: Line of Best Fit
In this activity, students learn to collect data and plot the data. They use the manual-fit feature to form a line of best fit.
Texas Instruments
Texas Instruments: How Do You Measure Up?
In this activity, students graph scatter plots to investigate possible relationships between two quantitative variables. They collect data and analyze several sets of data pairing the two quantities.
Texas Instruments
Texas Instruments: Mc Dougal Littell Middle School Math: Making Data Displays
Students will create data displays using a scatter plot and a line graph of the data and a circle graph of survey data.
Mangahigh
Mangahigh: Data: Scatter Plots
This site provides students practice with the concept of scatter plots. Students can learn about the topic by completing an interactive tutorial. Students can then take a ten question timed test to practice the skill.
National Council of Teachers of Mathematics
Nctm: Illuminations: Linear Regression 1
An interactive program where students will explore regression lines. Students will be introduced to the correlation coefficient and come to understand what it represents through the given exploration. Requires Java.
CK-12 Foundation
Ck 12: Statistics: Applications of Box and Whisker Plots Grade 8
[Free Registration/Login may be required to access all resource tools.] Using box-and-whisker plots to understand and interpret data.
Other
Sky Mark: Scatter Plots
This page gives a description of scatter plots along with examples. Also provides explanations and statistics to aid student understanding.
ClassFlow
Class Flow: Data Analysis Using Graphing
[Free Registration/Login Required] This flipchart allows students to analyze data using appropriate graphs, including pictographs, histograms, bar graphs, line graphs, circle graphs, and line plots introduced earlier, and using...
Khan Academy
Khan Academy: Review: Clusters in Scatter Plots
An article that discusses what we mean when we talk about clusters in scatter plots. It also includes practice questions that test your knowledge of the topic.
Khan Academy
Khan Academy: Review: Outliers in Scatter Plots
Learn about the points that don't fit the pattern in a scatter plot with this article. Site also includes practice questions to test your knowledge of the topic.
Sophia Learning
Sophia: Linear Correlation Tutorial
Use examples to determine and explain the linear correlation of independent and dependent variables.
Shodor Education Foundation
Shodor Interactivate: Lesson: Box Plots
This lesson plan introduces quartiles and box plots. It contains an activity and discussion. Supplemental activities about how students can represent data graphically are also included.
Oswego City School District
Regents Exam Prep Center: Categorizing Data
Three lessons on different types of data (qualitative, quantitative, univariate, bivariate, biased data) as well as a practice activity and teacher resource.
McGraw Hill
Glencoe Mathematics: Online Study Tools: Scatter Plots
This site gives a short interactive quiz which allows students to self-assess their understanding of the concept of scatter plots.
CK-12 Foundation
Ck 12: Algebra: Applications of Function Models
[Free Registration/Login may be required to access all resource tools.] In this lesson students draw a scatter plot of data, find and draw the function that best fits that data, and make predictions from that information. Students watch...
National Council of Teachers of Mathematics
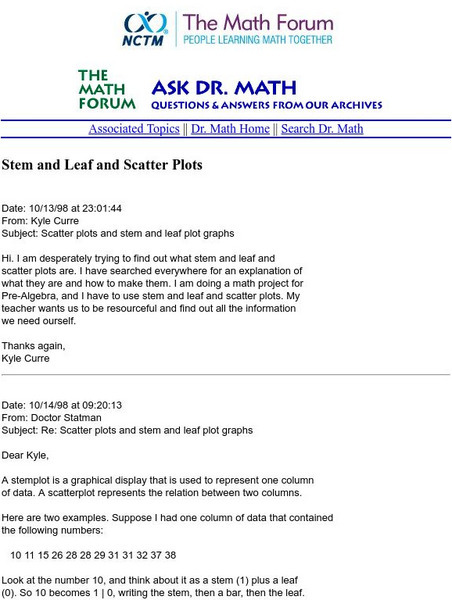
The Math Forum: Nctm: Ask Dr. Math: Stem and Leaf and Scatter Plots
This site is a question/response page which focuses on stem-and-leaf representation and how to construct scatter plots. Dr. Math works through an example and gives commentary notes. Site also contains links for more help.
Oswego City School District
Regents Exam Prep Center: Practice With Organizing and Interpreting Data
Several problems are presented to test your skills in creating and interpreting frequency tables, pie charts, box-and-whisker and stem-and-leaf plots.
University of Waterloo (Canada)
Univ. Of Waterloo: Wired Math: Linear Graphing: Graphing and Analyzing [Pdf]
The mathematics resource assesses students on linear relations. The activity has problems with graphing and analyzing linear relations. Some of the topics included are variation, scatter plots and linear relationships. The worksheet has...
Khan Academy
Khan Academy: Eyeballing the Line of Best Fit
Students practice informally graphing a line of best fit to a scatter plot and answer questions to determine if a scatter plot has a correlation. Students receive immediate feedback and have the opportunity to watch a video, get hints,...
Khan Academy
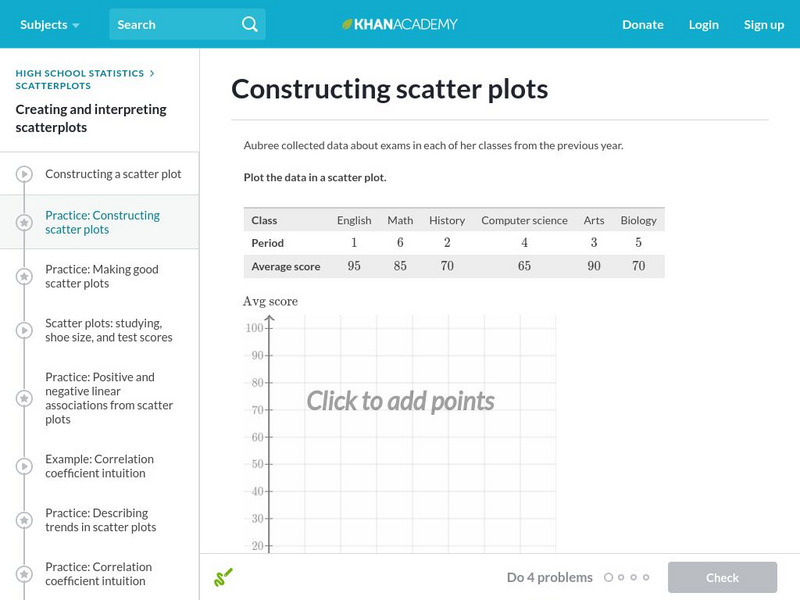
Khan Academy: Constructing Scatter Plots
Practice plotting points to construct a scatter plot. Students receive immediate feedback and have the opportunity to try questions repeatedly, watch a video, or receive hints.
Khan Academy
Khan Academy: Describing Trends in Scatter Plots
Practice making sense of trends in scatter plots. That is, explain what trends mean in terms of real-world quantities. Students receive immediate feedback and have the opportunity to try questions repeatedly, watch a video, or receive...







![Univ. Of Waterloo: Wired Math: Linear Graphing: Graphing and Analyzing [Pdf] Unknown Type Univ. Of Waterloo: Wired Math: Linear Graphing: Graphing and Analyzing [Pdf] Unknown Type](https://d15y2dacu3jp90.cloudfront.net/images/attachment_defaults/resource/large/FPO-knovation.png)

