Khan Academy
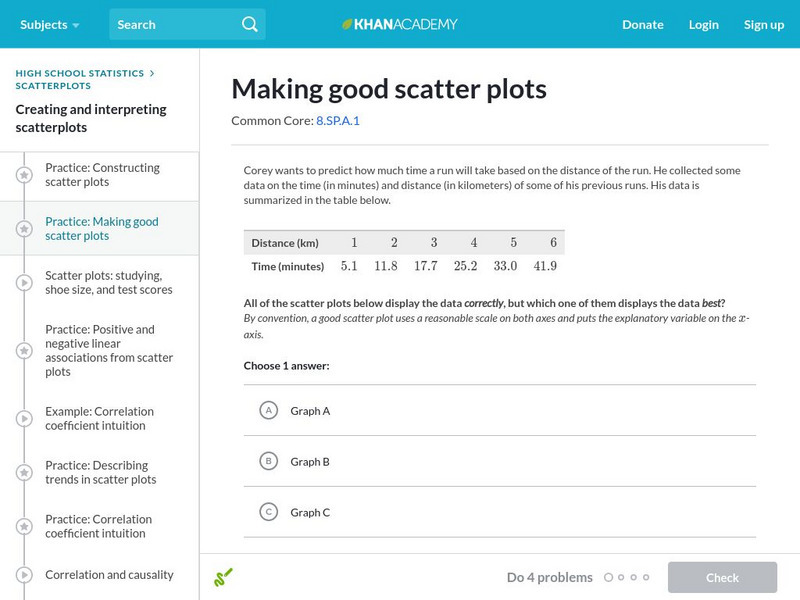
Khan Academy: Making Good Scatter Plots
A good scatter plot has the independent variable on the x-axis and the dependent variable on the y-axis. Also, the scale of both axes should be reasonable, making the data as easy to read as possible. In these practice problems, we...
Khan Academy
Khan Academy: Positive and Negative Linear Associations From Scatter Plots
Practice identifying the types of correlations shown in scatter plots. Sometimes we see linear correlations (positive or negative), sometimes we see non-linear correlations (the data seems to follow a curve), and other times we don't see...
Illustrative Mathematics
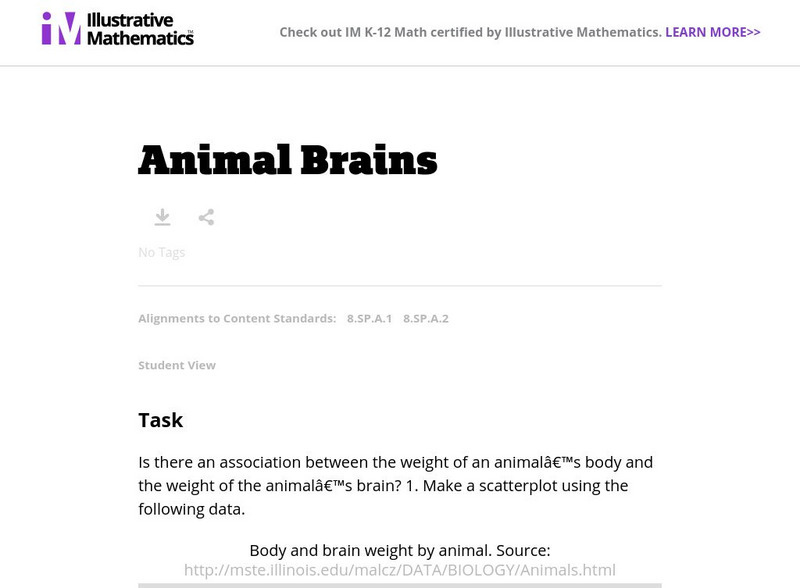
Illustrative Mathematics: 8.sp Animal Brains
This task looks at a possible relationship between the weight of an animal's body and the weight of its brain. Students make a scatter plot of data, look for outliers, make a second scatter plot without the outliers, and describe the...
Illustrative Mathematics
Illustrative Mathematics: 8.sp.1 Hand Span and Height
This task looks at a possible relationship between height and hand size. Students collect data from classmates, make a scatter plot, and explain the relationship as linear or nonlinear. Aligns with 8.SP.A.1.
Illustrative Mathematics
Illustrative Mathematics: 8.sp.1 Texting and Grades I
This task looks at a possible relationship between how many text messages high school students send and their grade point average. The data is presented in a scatter plot which students must examine for patterns and deviations. Aligns...
Illustrative Mathematics
Illustrative Mathematics: 8.sp Birds' Eggs
A scatter plot showing data for the sizes of birds' eggs is presented. Students are to look for correlations and make predictions whose values fall within the data range. They are also to make generalizations about the characteristics of...
ArtsNow
Arts Now Learning: The Sound of Numbers [Pdf]
In this lesson, students will explore numbers and their relationships through rhythm and learn how every aspect of music can be described mathematically. Includes a probability challenge for students.
CK-12 Foundation
Ck 12: Algebra: Fitting Lines to Data
[Free Registration/Login may be required to access all resource tools.] Learn how to write equations of best fit lines.
US Department of Education
Nces Kids: Create an Xy Graph
This is where you can find a step by step explanation of how to create an XY graph. When you finish each step just click the next tab and you will find the next set of instructions.
CK-12 Foundation
Ck 12: Statistics: Scatter Plots Grade 8
[Free Registration/Login may be required to access all resource tools.] Represent data in a scatterplot.
CK-12 Foundation
Ck 12: Statistics: Scatter Plots and Linear Correlation
[Free Registration/Login may be required to access all resource tools.] In this tutorial, students learn how to interpret data through the use of a scatter plot.
Alabama Learning Exchange
Alex: Get on Your Mark, Get Set, Go!
In collaborative/cooperative groups, students will review basic vocabulary and concepts for data and statistics. Students will create, collect, display, and interpret data in the form of frequency tables, bar graphs and circle graphs.
Alabama Learning Exchange
Alex: Statistically Thinking
The object of this project is for students to learn how to find univariate and bivariate statistics for sets of data. Also, the students will be able to determine if two sets of data are linearly correlated and to what degree. The...
National Council of Teachers of Mathematics
Nctm: Illuminations: Advanced Data Grapher
The Advanced Data Grapher can be used to analyze data with box plots, bubble graphs, scatterplots, histograms, and stem-and-leaf plots.
National Council of Teachers of Mathematics
Nctm: Illuminations: Line of Best Fit
Use this activity to practice how to enter a set of data, plot the data on a coordinate grid, and determine the equation for a line of best fit.
Shodor Education Foundation
Shodor Interactivate: Box Plot
Students can create box plots for either built-in or user-specified data as well as experiment with outliers. User may choose to use or not use the median for calculation of interquartile range.
Shodor Education Foundation
Shodor Interactivate: Regression
Plot a bivariate data set, determine the line of best fit for their data, and then check the accuracy of your line of best fit.
Shodor Education Foundation
Shodor Interactivate: Scatter Plot
Graph ordered pairs and customize the graph title and axis labels. Points are connected from left to right, rather than being connected in the order they are entered.
Shodor Education Foundation
Shodor Interactivate: Linear Regression and Correlation
Students are introduced to correlation between two variables and the line of best fit.
Shodor Education Foundation
Shodor Interactivate: Comparison of Univariate and Bivariate Data
Students learn about the difference between univariate and bivariate data and understand how to choose the best graph to display the data.
Quia
Ixl Learning: Scatter Plots
Brush up on your math skills relating to scatter plots then try some practice problems to test your understanding.
Other
Nearpod: Construct & Interpret Scatter Plots
In this lesson plan on scatter plots, 8th graders will learn how to interpret scatter plots and then graph them using a data table.
National Council of Teachers of Mathematics
Nctm: Figure This: Does It Make a Difference Where You Shop?
A math investigation that uses scatter plots to compare prices of favorite soft drinks. Discover how valuable your skills in organizing and displaying data can be in real life scenarios.
Shodor Education Foundation
Shodor Interactivate: Simple Plot
A java applet that helps a student to create a scatter plot using the coordinates and axes and given data.


