University of Regina (Canada)
University of Regina: Math Central: Scatter Plots
Three different concepts are examined about scatter plots. Topics featured are collecting data, analyzing scatter plots, and determining a line of "best fit". The lesson has an overview, material, procedures, and evaluation techniques.
National Council of Teachers of Mathematics
The Math Forum: Graphing Linear Equations
This site from The Math Forum provides chat areas, simulations, JAVAapplets, problems, answers, puzzles, quizzes and tutoring! Links are also provided for additional information.
National Council of Teachers of Mathematics
The Math Forum: A Collection of Secondary Math Units
Teachers of grades 9-12 can explore these seven math units for their classes. Data collection and analysis, problem solving with spreadsheets, and linear transformation are just a few of the topics covered here.
Texas Instruments
Texas Instruments: Walking the Line
In this activity, students use linear functions to model and solve problems in situations with slope and a constant rate of change. They learn to represent situations with variables in expressions, equations, and inequalities and use...
Texas Instruments
Texas Instruments: Inverse of Two Temps
In this activity, students find a conversion equation that will calculate the corresponding Celsius temperature for any given Fahrenheit temperature. Students learn to graph scatter plots, analyze and graph linear equations, compute and...
Texas A&M University
Wtamu Virtual Math Lab: Intermediate Algebra: Graphing Equations
Through this tutorial, you will learn how to solve equations by graphing them on a coordinate plane. Contains several examples with step-by-step solutions and practice exercises for you to complete and check.
Texas A&M University
Wtamu Virtual Math Lab: Beginning Algebra: Reading Graphs
A good introduction to reading bar, line, and double line graphs, and drawing and reading Venn diagrams. Contains definitions and examples of these types of charts and graphs as well as practice exercises that ask you to answer questions...
Other
Calculus Preview
The resource gives students a preview of topics learned in Calculus. Concepts included are graphs, speed, and integration. Graphs, tables, and an interactive applet are used to investigate the examples.
Other
Hsor.org: Miguel Chooses a College: Tradeoffs
Use several strategies and criteria to help Miguel determine the college for him.
Math Planet
Math Planet: Algebra 2: Graph Functions and Relations
Provides examples and a video lesson that illustrates how to graph a linear equation. [1:33]
University of Cambridge
University of Cambridge: Maths and Sports: Charting Success
Sports statisticians, trainers and competitors create graphs, charts and diagrams to help them to analyse performance, inform training programmes or improve motivation. This activity encourages students to consider and analyse...
Mangahigh
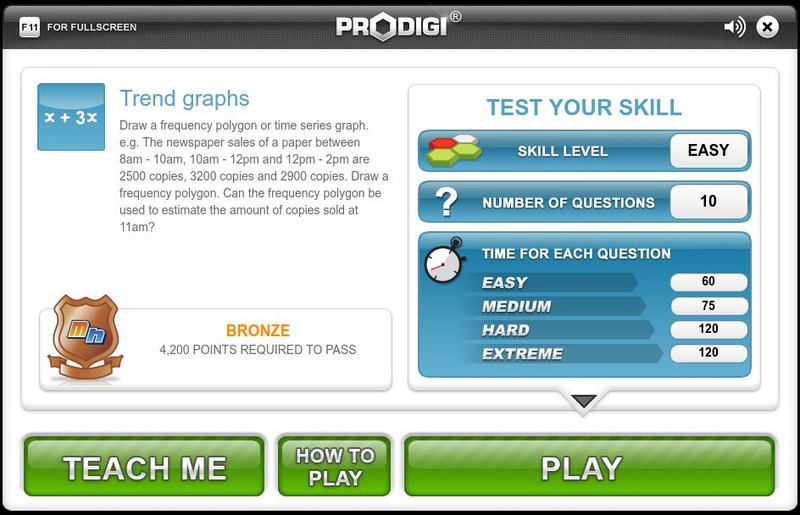
Mangahigh: Data: Trend Graphs
Students explore the concept of frequency trend graphs by working through an online tutorial and then attempting a ten question quiz that increases in difficulty as questions are answered correctly.
CK-12 Foundation
Ck 12: Algebra: Graphs in the Coordinate Plane
[Free Registration/Login may be required to access all resource tools.] Students learn to use tables of values and rules to graph functions. Students examine guided notes, review guided practice, watch instructional videos and attempt...
CK-12 Foundation
Ck 12: Algebra: Graphs of Linear Equations
[Free Registration/Login may be required to access all resource tools.] Students learn to write and graph linear equations to represent a function and analyze graphs of linear functions. Students examine guided notes, review guided...
CK-12 Foundation
Ck 12: Algebra: Problem Solving With Linear Graphs
[Free Registration/Login may be required to access all resource tools.] Devise a problem-solving strategy that uses a graph to solve real-world problems.
Varsity Tutors
Varsity Tutors: Hotmath: Practice Problems: Statistics
Fifteen problems presented on the topics: mean, median, mode, outliers and graphing statistics. They are given with each step to the solution cleverly revealed one at a time. You can work each step of the problem then click the "View...
Illustrative Mathematics
Illustrative Mathematics: N q.a.1 and N q.a.3: Felicia's Drive
This task requires students to make some sensible approximations of the amount of gas needed for a drive. They must choose a level of accuracy appropriate to limitations on measurement when reporting quantities. Aligns with N-Q.A.1 and...
University of Regina (Canada)
University of Regina: Math Central: Scatter Plots
Three different concepts are examined about scatter plots. Topics featured are collecting data, analyzing scatter plots, and determining a line of "best fit". The activity has an overview, material, procedures, and evaluation techniques.
Texas Education Agency
Texas Gateway: Predicting, Finding, and Justifying Data From a Graph
Given data in the form of a graph, the student will use the graph to interpret solutions to problems.
Texas Education Agency
Texas Gateway: Predicting, Finding, and Justifying Solutions to Problems
Given application problems, the student will use appropriate tables, graphs, and algebraic equations to find and justify solutions to problems.
Oswego City School District
Regents Exam Prep Center: Practice With Organizing and Interpreting Data
Several problems are presented to test your skills in creating and interpreting frequency tables, pie charts, box-and-whisker and stem-and-leaf plots.
University of Waterloo (Canada)
Univ. Of Waterloo: Wired Math: Linear Graphing: Graphing and Analyzing [Pdf]
The mathematics resource assesses students on linear relations. The activity has problems with graphing and analyzing linear relations. Some of the topics included are variation, scatter plots and linear relationships. The worksheet has...
University of Texas at Austin
Mathematics Teks Toolkit: Making Connections
In this instructional activity, students will use input/output tables to explore functions, equations, and graphs.


