Curated OER
Trains in Motion
Students compare two object as they find the distance between them. In this geometry lesson, students create an equation describing the distance of time as a function. They use the navigator to observe the distance.
Alabama Learning Exchange
Density
High schoolers observe a demonstration of regular soda versus diet soda. In this exploring density instructional activity students complete a lab on density and present a PowerPoint presentations of their results.
Texas Instruments
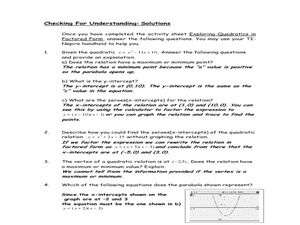
Exploring Quadratics in Factored Form
Young mathematicians explore quadratics equations in this lesson. They investigate the relationship between the standard form and factored form of quadratic equations. Learners then examine the relationship between the factoring form of...
Curated OER
The Factor Connection
Pupils investigate the connection between factors, zeros, and graphs of quadratic functions. The lesson plan requires the TI-nspire handheld.
Curated OER
Find Minimum and Maximum
Learners engage in a lesson about finding the values of different graphs written in the vertex form. They rewrite each quadratic equation in vertex form while graphing the equation with the visual display of a parabola that matches the...
Curated OER
Using Symmetry to Find the Vertex of a Parabola
Learners engage in a lesson that is about finding the vertex of a parabola while using symmetry. They use the symmetry to find out where the two lines meet. The line is displayed with the help of a graphing calculator. The lesson...
Curated OER
The Standard Form of A Quadratic Equation
Students investigate equations that are in the standard form of a quadratic equation represented as Y=ax2+bx+c. They factor the equations into linear factors to determine the x intercepts. The graph is also used to determine the x...
Texas Instruments
Say What You Mean!
Students analyze data and identify the mean. In this probability lesson, students log data in the TI and construct scatter plots from the data. They identify properties of a scatterplot.
Shodor Education Foundation
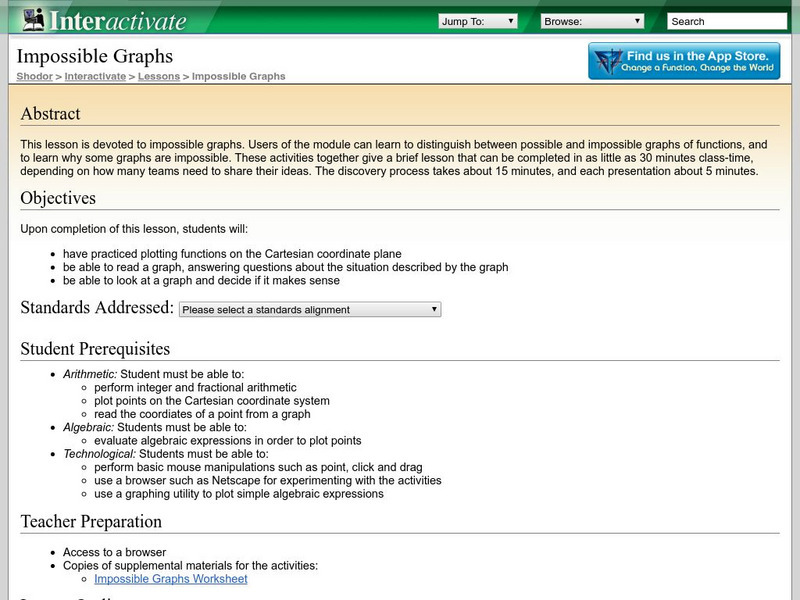
Shodor Interactivate: Lesson: Impossible Graphs
The lesson plan, with objectives, lesson outline, and a plotting-practice activity, examines impossible graphs.
Student Achievement Partners
Student Achievement Partners: Penny Circle Task [Pdf]
Students will explpre models and understand the difference between quadratic, exponential, and linear models in this lesson.
Texas Education Agency
Texas Gateway: Functions and Their Inverses
Given a functional relationship in a variety of representations (table, graph, mapping diagram, equation, or verbal form), the student will determine the inverse of the function.
Varsity Tutors
Varsity Tutors: Hotmath: Practice Problems: Relations and Functions
Hotmath provides eighteen practice problems dealing with relations, functions, and their graphs. Each of the practice problems include a step-by-step guide for solving their Algebraic problem.
Oswego City School District
Regents Exam Prep Center: Graphs of the Inverse Trig Functions
This site reviews basic information on inverse functions and inverse notation. Graphs of inverse trig functions are shared and discussed.
Texas Education Agency
Texas Gateway: Writing Verbal Descriptions of Functional Relationships
Given a problem situation containing a functional relationship, the student will verbally describe the functional relationship that exists.
Paul Dawkins
Paul's Online Notes: Algebra: Graphing Functions
Detailed math tutorial features notes and examples that take a look at graphing functions including several examples of graphing piecewise functions.
Paul Dawkins
Paul's Online Notes: Algebra: The Definition of a Function
Detailed math tutorial features definitions and examples that take a look at relations and functions, function notation, the domain and range of a function, and piecewise functions.
Paul Dawkins
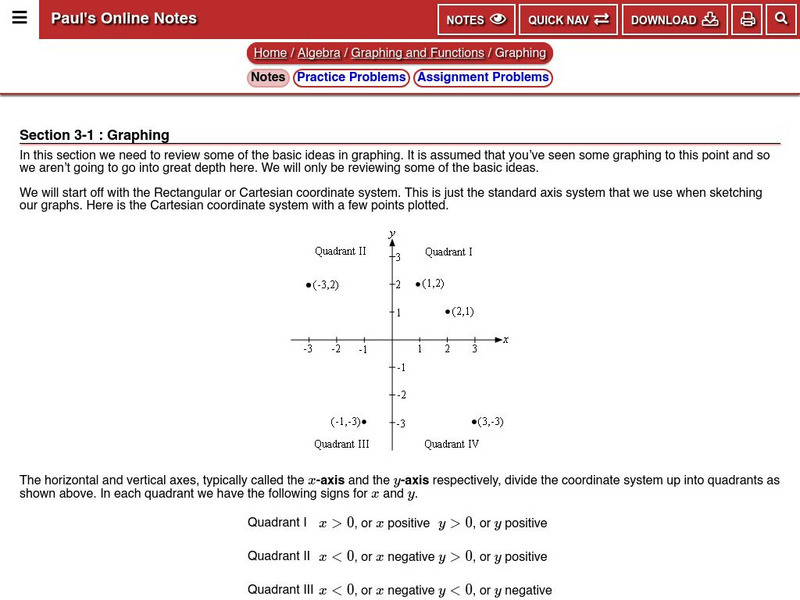
Paul's Online Notes: Algebra: Graphing
Detailed math tutorial features notes and examples that take a look at the Cartesian (or Rectangular) coordinate system. Provides definitions of ordered pairs, coordinates, quadrants, and x and y-intercepts.
CK-12 Foundation
Ck 12: Interactive Algebra 1 for Ccss
This is a complete, full-year Algebra 1 course with interactivity included in every lesson. Some lessons include videos, and all include interactives and inline questions that offer instant, per-answer feedback. Every lesson also has...
Shodor Education Foundation
Shodor Interactivate: Functional Graphs
Students will graph input/output pairs from a simple linear function in order to gain an understanding of basic linear functions.
University of Regina (Canada)
University of Regina: Math Central: Basics of Graphing
Students learn the basics of graphing including terminology, plotting, and reading points. The lesson plan has an overview, materials, procedures, and evaluation techniques.
University of Regina (Canada)
University of Regina: Math Central: Linear Graphs
Students gain the knowledge of how to plot and recognize first degree equations on a graph. The lesson plan has an overview, materials, procedures, and evaluation techniques.
Windstream
Ojk's Precalculus Study Page: Quadratic Functions: Graphs
A tutorial devoted to the steps used to graph a quadratic function. Includes tables, graphs, and several sample problems.
Shodor Education Foundation
Shodor Interactivate: Lesson: Reading Graphs
Presents an introductory lesson to teach students how to read and plot graphs and determine functions based on graphs.
Texas Instruments
Texas Instruments: Graph of Common Functions 1
This StudyCard stack tests students on their ability to study graphs and write functions that represent the relationship between two variables displayed by the graph.


![Student Achievement Partners: Penny Circle Task [Pdf] Lesson Plan Student Achievement Partners: Penny Circle Task [Pdf] Lesson Plan](https://d15y2dacu3jp90.cloudfront.net/images/attachment_defaults/resource/large/FPO-knovation.png)


