Physics Classroom
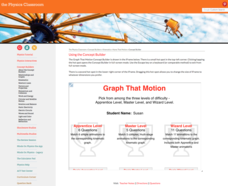
Graph That Motion
Pupils apply their knowledge of the shape and slope of graphs to interpret the motion of an object. Three levels of difficulty provide plenty of practice with support thanks to the "Help Me!" button offered with each question.
Shodor Education Foundation
Multi-Function Data Flyer
Explore different types of functions using an interactive lesson. Learners enter functions and view the accompanying graphs. They can choose to show key features or adjust the scale of the graph.
Shodor Education Foundation
Incline
Study velocity while examining graphical representations. As scholars work with the animation, they discover the effect the height of an incline has on the velocity of the biker. They make conclusions about the slope of the...
Shodor Education Foundation
Vertical Line Test
Connect the points to create a function. Using points given by the applet, pupils try to connect them to create a line that would pass the vertical line test. The resource keeps track of the number of sets the learner is able to identify...
Mathematics Assessment Project
Representing Functions of Everyday Situations
Functions help make the world make more sense. Individuals model real-world situations with functions. They match a variety of contexts to different function types to finish a helpful resource.
CK-12 Foundation
Restricted Domain and Range: Translation of a Curve
Moving the graph of a function obviously changes its domain and range. Scholars adjust the location of a graph in an interactive coordinate plane. The interactive automatically updates and displays the domain and range to show how it...
Georgetown University
Cup-Activity: Writing Equations From Data
Determine how cup stacking relates to linear equations. Pupils stack cups and record the heights. Using the data collected, learners develop a linear equation that models the height. The scholars then interpret the slope and the...
CK-12 Foundation
Restricted Domain and Range: Restricted Circle Radius and Area
There's no restriction to how much your class can learn about domain and range. Users of an interactive adjust the radius of a circle to see its effects on the area. They note how restrictions in the domain (radius) relate to...
Towson University
The Crucial Concentration
Which sports drink provides the best pick-me-up after the big game or grueling workout? It may not be the one you'd think! Food science is the focus in a surprising lab activity. Pupils use colorimetry to determine the amount of protein,...
CK-12 Foundation
Domain and Range of a Function: Making Money Math
Graphs are useful for many things, including seeing how much money you can make. Individuals create a graph of earnings from a job based on the number of hours. They determine the domain and range of the graph and answer challenge...
CK-12 Foundation
Linear and Non-Linear Function Distinction: Domain and Range of a Function
Functions are special types of relations, but what makes them so special? Pupils use an interactive to slide a vertical line across six different graphs. Ten challenge questions then assess understanding of functions.
Mathematics Vision Project
Features of Functions
What are some basic features of functions? By looking at functions in graphs, tables, and equations, pupils compare them and find similarities and differences in general features. They use attributes such as intervals of...
PBL Pathways
Doctors and Nurses
How many nurses does it take to support one doctor? A project-based activity asks learners to analyze state data to answer this question. Classes create polynomial functions from the data of doctors and nurses over a seven-year...
PBL Pathways
Students and Teachers 2
Examine trends in student-to-teacher ratios over time. Building from the first task in the two-part series, classes now explore the pattern of student-to-teacher ratios using a non-linear function. After trying to connect the pattern to...
Virginia Department of Education
Functions 1
Scholars learn what it means for a relation to be a function and see various representations of functions. After learning the definition, they participate in a card sorting activity classifying relations as functions or not.
Point Pleasant Beach School District
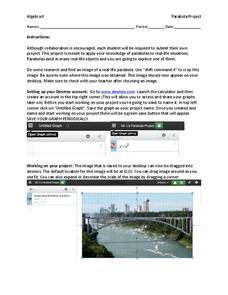
Parabola Project
Class members select a picture that contains a parabola and construct a drawing of it using function graphs in the quadratic project. Individuals restrict the domains of the functions to create a more accurate drawing. They then submit a...
University of Colorado
The Moons of Jupiter
Can you name the three planets with rings in our solar system? Everyone knows Saturn, many know Uranus, but most people are surprised to learn that Jupiter also has a ring. The third in a series of six teaches pupils what is around...
Balanced Assessment
Postcards from the Falls
Pupils use graphs to analyze two pricing schemes for postcards. After determining which is the best deal, individuals determine what is wrong with the other pricing structures and explain their thinking.
Balanced Assessment
Melons and Melon Juice
Model the difference between the graphs of discrete and continuous functions. Scholars examine two scenarios and construct graphs to model the situation. They then compare their graphs that illustrate the subtle difference between these...
Inside Mathematics
Graphs (2007)
Challenge the class to utilize their knowledge of linear and quadratic functions to determine the intersection of the parent quadratic graph and linear proportional graphs. Using the pattern for the solutions, individuals develop a...
Inside Mathematics
Graphs (2004)
Show your pupils that perimeter is linear and area is quadratic in nature with a short assessment task that requests learners to connect the graph and equation to a description about perimeter or area. Scholars then provide a...
Teach Engineering
Coordinates and the Cartesian Plane
The plot thickens to get a functional understanding. After a short review of plotting points on the coordinate plane, class members learn the difference between functions and relations in the second lesson plan in a series of nine....
EngageNY
End-of-Module Assessment Task - Algebra 2 (Module 3)
The last installment of a 35-part series is an assessment task that covers the entire module. It is a summative assessment, giving information on how well pupils understand the concepts in the module.
EngageNY
Graphing the Logarithmic Function
Teach collaboration and communication skills in addition to graphing logarithmic functions. Scholars in different groups graph different logarithmic functions by hand using provided coordinate points. These graphs provide the basis for...


