Mathematics Vision Project
Module 7: Structure of Expressions
The structure of an expression is a descriptive feature. Learners build a solid understanding of quadratic functions using an analysis of expressions in different forms. The seventh module in a series of nine includes 12 lessons...
Mathematics Vision Project
Module 3: Features of Functions
Learn how to represent functions in multiple ways. Learners analyze functions as equations, graphs, and verbal descriptions. The analysis includes intercepts, behavior, domain, and range. The module of seven lessons makes up the third...
Mathematics Vision Project
Module 2: Linear and Exponential Functions
Write, graph, and model all things linear and exponential. Building on the previous module in a nine-part Algebra I series, learners compare linear exponential modeling. They write equations, graph functions, and analyze key features.
Concord Consortium
Adding the Sines
It's a sign! Scholars analyze sine functions for patterns in their periods. The exploration advances beyond a simple function to the combination of two functions with even and odd coefficients. Their goal is to find a pattern between the...
Concord Consortium
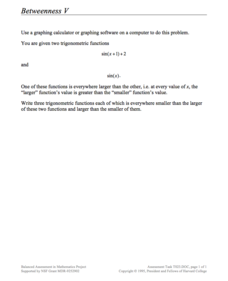
Betweenness V
Take a unique approach to study the graphing of trigonometric functions. Young scholars consider two sine functions and write three functions that will lie between the two given. They use a graphing utility to assist in their explorations.
Concord Consortium
Betweenness IV
Challenge your classes to think between the curves. Given two function formed by the combination of two exponential functions, individuals must write three functions in which all values would lie between the given. The question is...
Concord Consortium
Betweenness III
Don't let a little challenge get between your pupils and their learning! Scholars compare two absolute value functions to recognize patterns and use them to build their own functions with outputs that are between the given. They then...
Concord Consortium
Betweenness II
Read between the curves ... quadratic curves! Young scholars analyze the graphs of two quadratic functions by writing their own function whose outputs are between the two given. They then consider intersecting quadratic functions and...
Project Maths
Trigonometric Functions
From a circle to a cycle! The final lesson of a five-part series challenges learners to use points from the unit circle to plot a repeating pattern. The repeating patterns become the graphs of the trigonometric functions. Scholars...
101 Questions
Will It Hit The Hoop?
Basketball and math go hand in hand, even before one considers creating statistics. Viewers see a basketball player attempt multiple shots, but they do not see whether it goes in. They solve for which shots earned points as well as which...
Kenan Fellows
Attack of the Aphids!
Insects threaten the food production industry, and aphids are one of the big players! Analyzing data of aphid populations gives insight into their behaviors. Learners model the population data of an uninhibited population with an...
101 Questions
Stopping Distances
In 2016, one in every four fatal car crashes listed speeding as a contributing factor. Pupils view videos of a car trying to come to a quick stop from four different rates of speed. They use context clues to measure and determine the...
101 Questions
Leap the Jeep
Will harm come to the child in the video? Find out by modeling the scenario mathematically! Learners represent the situation with a quadratic model before deciding on a maximum height and time the person is in the air. Too low or not...
101 Questions
Angry Bird Quadratics
Launch your classes into a modeling lesson. Young scholars watch angry bird trajectories and make predictions based on their knowledge of quadratic functions. The lesson includes a series of questioning strategies to lead learners to the...
Shodor Education Foundation
Graphit
No graphing calculator? No worries, there's an app for that! Young mathematicians use an app to graph functions. In addition, they can also plot data points.
Shodor Education Foundation
Graph Sketcher
Sketch graphs with the Graph Sketcher. Scholars graph functions on a coordinate plane. An interactive makes it as easy as inputting the function and clicking a button.
Shodor Education Foundation
Function Flyer
Fly through graphing functions with the Function Flyer. Young mathematicians use an interactive to graph different types of functions. A set of exploration questions has users investigate patterns in functions.
Shodor Education Foundation
Data Flyer
Fit functions to data by using an interactive app. Individuals plot a scatter plot and then fit lines of best fit and regression curves to the data. The use of an app gives learners the opportunity to try out different functions to see...
Shodor Education Foundation
Multi-Function Data Flyer
Explore different types of functions using an interactive lesson. Learners enter functions and view the accompanying graphs. They can choose to show key features or adjust the scale of the graph.
Shodor Education Foundation
Vertical Line Test
Connect the points to create a function. Using points given by the applet, pupils try to connect them to create a line that would pass the vertical line test. The resource keeps track of the number of sets the learner is able to identify...
Shodor Education Foundation
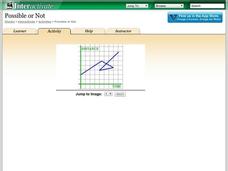
Possible or Not?
What does the graph mean? Pupils view 10 graphs and determine whether they are possible based on their contexts. The contexts are distance versus time and profit versus time.
Mathematics Assessment Project
Representing Functions of Everyday Situations
Functions help make the world make more sense. Individuals model real-world situations with functions. They match a variety of contexts to different function types to finish a helpful resource.
Mathematics Assessment Project
Representing Quadratic Functions Graphically
Sometimes being different is an advantage. An engaging activity has scholars match cards with quadratic functions in various forms. Along the way, they learn about how each form highlights key features of quadratic functions.
CK-12 Foundation
Infinite Limit Type: Asymptotes and End Behavior Question
There are an infinite number of reasons to use the resource. Scholars drag vertical and horizontal lines to the graph of a rational function to identify all asymptotes. They investigate the connection between asymptotes and limits to...


