Science Education Resource Center at Carleton College
Serc: Using an Applet to Demonstrate a Sampling Distribution
In this activity students are exposed to the concept of sampling distributions by creating an example as a class. By having the students assemble the data, they can more readily understand that a sampling distribution is made up of a...
Mangahigh
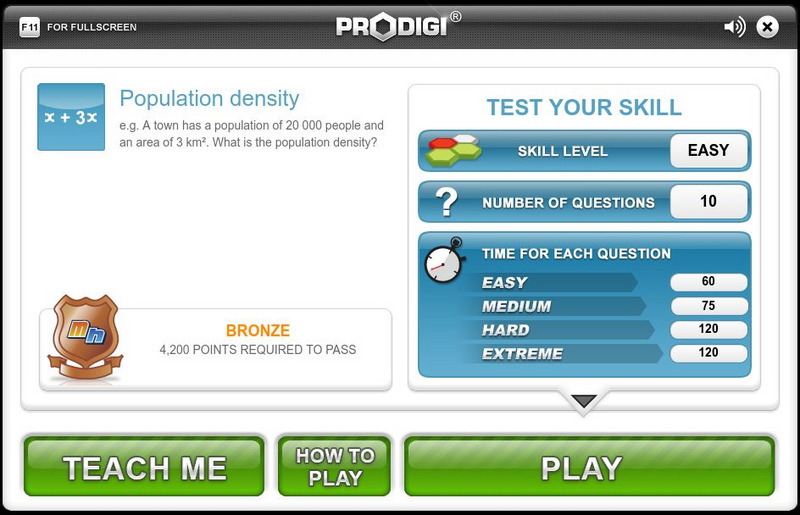
Mangahigh: Shape: Population Density
Test your knowledge of population density by determining the number of people per square unit.
Sophia Learning
Sophia: Practical Applications of the Bell Shaped Curve
Explore the bell-shaped curve and how to calculate a z score. Additional links provided to further knowledge on outliers.
Web Center for Social Research Methods
Research Methods Knowledge Base: Sampling in Research
Site discusses the use of sampling in research. The key statistical terms used in sampling are linked for the user to quickly find definitions. The major concepts of probability and nonprobability are also highlighted.
Other
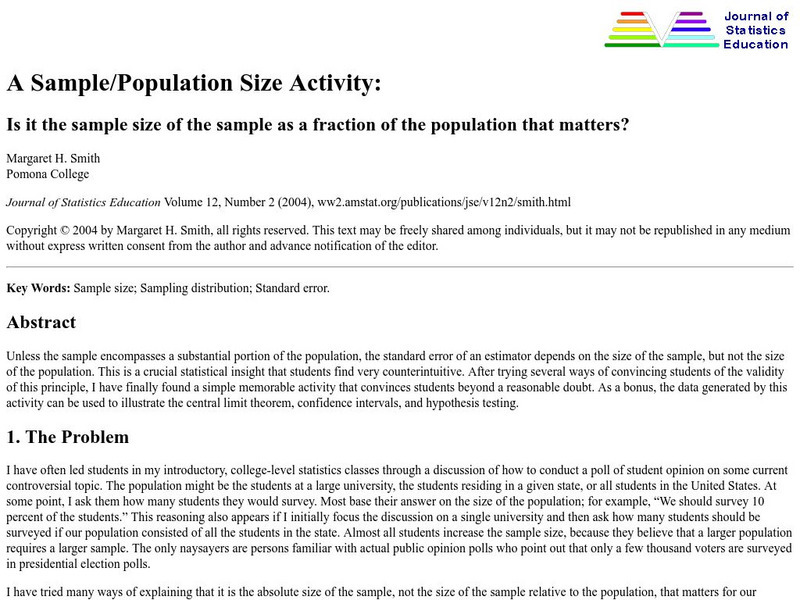
Journal of Statistics Education: A Sample / Population Size Activity
The author of the article admits having had a difficult time in the past when getting students to understand that samples need to contain a substantial portion of the population. Here, an activity is detailed to bring this important fact...
Texas Instruments
Texas Instruments: Special Cases of Normally Distributed Data
Students perform single and two-sample t procedures to investigate special cases of normally distributed data. They explore inference for a least-square regression line, including the confidence interval.
Other
West Virginia University: Normal Distribution
The history of the normal curve and its use in statistics is presented. An Applet is provided for the user to adjust the left and right edges of the probability and see the effect on the area under the curve.
Texas Instruments
Texas Instruments: The Normal Distribution
In this activity, students will apply the normal density function, normal cumulative distribution function, and inverse normal cumulative function to analyze a population with a normal distribution.
Texas Instruments
Texas Instruments: The Normal Distribution
Students graph normal distributions, shade desired areas, and find related probabilities. They graph Normal probability scatter plots to check the normal (linear) shape of a data distribution.
Stefan Warner and Steven R. Costenoble
Finite Mathematics & Applied Calculus: Random Variables and Distributions
Students examine random variables and distributions. Topics explored are probability distributions, and discrete and continuous random variables. The tutorial investigates the statistics concepts through class notes and examples. Review...
University of New Brunswick (Canada)
University of New Brunswick: Sample, Random, Systematic, Stratified Sampling
This site contains explanations and examples of the different kinds of data sampling.
Math Planet
Math Planet: Algebra 2: Standard Deviation and Normal Distribution
Gain an understanding of standard deviation and normal distribution by viewing an example and a video lesson.
Illustrative Mathematics
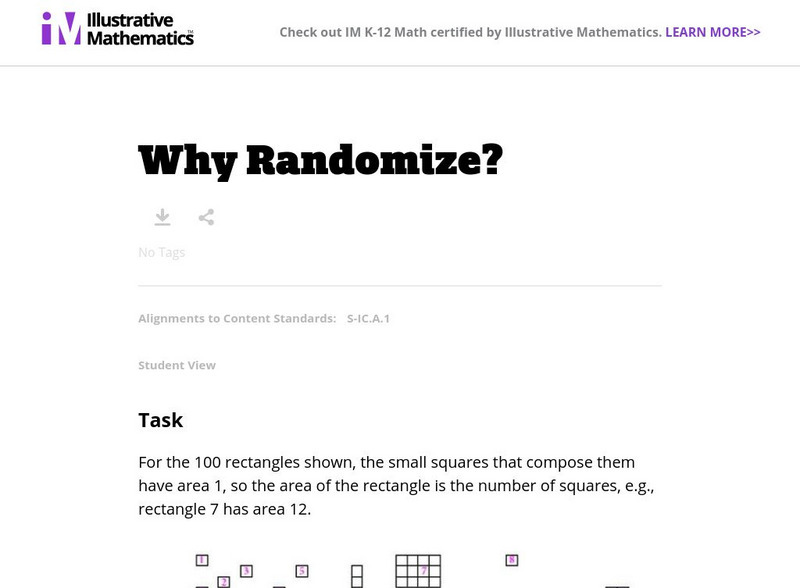
Illustrative Mathematics: S Ic Why Randomize?
The exercise demonstrates that judgment (non-random) samples tend to be biased in the sense that they produce samples that are not balanced with respect to the population characteristics of interest. Students will estimate the mean...
Other
Magoosh: Statistics Fundamentals
An online course on the fundamentals of statistics including video lessons in Mean, Median, and Mode; Weighted Averages; Quartiles and Boxplots; Range and Standard Deviation; Normal Distribution; Z-scores; Intro to Inferential...
CK-12 Foundation
Ck 12: Statistics: Sampling Methods
[Free Registration/Login may be required to access all resource tools.] Decide how to choose a sampling of a population to produce reliable statistical results.
CK-12 Foundation
Ck 12: Statistics: Sampling Distributions
[Free Registration/Login may be required to access all resource tools.] This concept introduces the sampling distribution of the mean, inferring the population mean from samples and sampling error.
CK-12 Foundation
Ck 12: Statistics: Central Limit Theorem
[Free Registration/Login may be required to access all resource tools.] Introduces students to the Central Limit Theorem. Students will learn about the Central Limit Theorem and calculate a sampling distribution using the mean and...
Concord Consortium
Concord Consortium: California American Community Survey (Acs) Data Portal
Working with large datasets that support exploration of patterns is an essential first step in becoming fluent with data. In this dynamic data science activity, students can access part of the U.S. Census Bureau's American Community...
Concord Consortium
Concord Consortium: National Health and Nutrition Examination Survey Data Portal
Access and explore large datasets from the National Health and Nutrition Examination Survey (NHANES, 2003). Working with large datasets that emphasize exploration, finding patterns, and modeling is an essential first step in becoming...
Shodor Education Foundation
Shodor Interactivate: Normal Distribution
Change the standard deviation of an automatically generated normal distribution to create a new histogram. Observe how well the histogram fits the curve, and how areas under the curve correspond to the number of trials.
CK-12 Foundation
Ck 12: Algebra Ii: 5.5 Sampling Variability
This section explores the concept of sampling variability in the sample proportion. It will address the effect on the mean and standard deviation of a sample distribution as the sampling size changes.
CK-12 Foundation
Ck 12: Algebra Ii: 5.8 Evaluating Reports
Learn to analyze examples of claims presented in the media that involve estimating a population proportion and population mean.
CK-12 Foundation
Ck 12: Algebra Ii: 5.7 Margin of Error
This section introduces the concept of Margin of Error. Explore how results from surveys are most accurate within a range of values, and use this concept to make inferences about the preferences of a full population, given data from a...
CK-12 Foundation
Ck 12: Algebra Ii: 5.4 Standard Deviation
Explore what the standard deviation is as it relates to the graph of a normal distribution curve.


