EngageNY
Ruling Out Chance (part 1)
What are the chances? Teach your classes to answer this question using mathematics. The first part of a three-day activity on determining significance differences in experimental data prompts learners to analyze the data by determining...
National Research Center for Career and Technical Education
Business Management and Administration: Compound Interest - A Millionaire's Best Friend
Many math concepts are covered through this resource: percentages, decimals, ratios, exponential functions, graphing, rounding, order of operations, estimation, and solving equations. Colorful worksheets and a link to a Google search for...
National Research Center for Career and Technical Education
Architecture and Construction: Stair Construction
Within the context of the construction industry, algebra pros begin to calculate slope from the sizes of stair steps. This is a terrific lesson, especially for aspiring engineers. Just be aware that it might be a stretch to meet all of...
National Research Center for Career and Technical Education
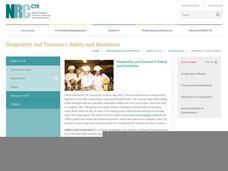
Hospitality and Tourism 1: Safety and Sanitation
Math and science come alive in this career-related instructional activity on sanitation. Along the way, learners explore bacterial growth rates using exponential notation and graphs. A link to a very brief, but vivid video shows just how...
Google
Surveys and Estimating Large Quantities
Looking for an estimation activity a bit more involved than the typical "guess the number of jellybeans in the jar" game? Here, learners use a picture to estimate the number of people at a large event, look for potential problems with...
Google
The Law of Large Numbers and Probability
Learners investigate why theoretical probability doesn't always match reality. The activity involves using Python 2.7 (or Sage) to set up a Bernoulli Trial. It also involves setting up a spreadsheet to simulate the Birthday Paradox....
Children’s Hospital of Philadelphia
Case Studies: Influenza and HIV
Stop infection spread. Pupils participate in an activity to model infections and replications of viruses. Within the activity, scholars see that viruses may end up with genetic variation and connect that to how some forms of the flu are...
National Research Center for Career and Technical Education
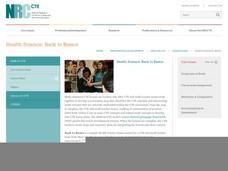
Health Science: Back to Basics
This lesson focuses on unit conversion, proportions, ratios, exponents, and the metric system. Discuss measurement with your math class and demonstrate how to solve several health-science word problems. Give learners a chance to visit an...
University of South Florida
Fcat: Drops on a Penny: Teacher Notes
Young scholars learn how to create stem-and-leaf diagrams and boxplots by collecting data on the surface tension of water molecules. This hands-on activity using pennies is a great way to learn how to organize data.
Rice University
Hyper Stat Online Statistics Textbook: Trend Analysis
A series of pages that help us understand testing one or more components of a trend using specific comparisons, a set of coefficients, error analysis of variance and the probability value.
Google
Google for Education: Application and Modeling of Standard Deviation
Young scholars examine graphs of data using each of the measures of central tendency to determine when to use each in order to get a true overview of the data.
Annenberg Foundation
Annenberg Learner: Against All Odds: Experimental Design
Video program explains the difference between observation and experiment and the principles of experiment design. Lesson draws on real-life example of heart disease study and a double-blind experiment. [28:39]
Science Education Resource Center at Carleton College
Serc: Reasoning About Center and Spread: How Do Students Spend Their Time?
Using their own habits for data, young scholars predict how much time they spend on different activities each day, and how much variability each activity is likely to have. They then collect data into a class spreadsheet and look at the...
Other
U. Of Wisconsin: Formulating Statistical Questions and Collecting Data
This slideshow gives a detailed explanation of the characteristics of statistical questions and how they differ from other types of questions, the types of studies, and the methods for collecting data. It describes the case of Clever...
Rice University
Hyper Stat Online Statistics Textbook: Logic of Hypothesis Testing
High level detailed steps including null hypothesis, alternative hypothesis, significance level, statistics, probability value and statistical significance.
Texas Education Agency
Texas Gateway: Tea Statistics: Discrete Distribution (Playing Card Experiment)
In this Stats lab, students will work with a set of playing cards and a calculator. They will compare empirical data and a theoretical distribution to determine if an everyday experiment fits a discrete distribution. They will compare a...
Texas Education Agency
Texas Gateway: Collecting Data and Making Predictions
Given an experimental situation, the student will write linear functions that provide a reasonable fit to data to estimate the solutions and make predictions.
Missouri State University
Missouri State University: Introductory Statistics: T Test: Experimental Designs
This discussion of statistical experimental designs is presented in notes with examples added as needed.
Cuemath
Cuemath: Discrete Data
A comprehensive guide for learning all about discrete data with definitions, the difference between discrete and continuous data, graphical representation of discrete data through visualization, solved examples, and interactive questions...
Dartmouth College
Dartmouth College: Mqed: Instructional Modules
The statistics resource consists of links to interactive programs that explore introductory statistics concepts. Topics include hypothesis tests, p-value, and analysis of variance.
University of Regina (Canada)
University of Regina: Math Central: Scatter Plots
Three different concepts are examined about scatter plots. Topics featured are collecting data, analyzing scatter plots, and determining a line of "best fit". The lesson has an overview, material, procedures, and evaluation techniques.
Texas Instruments
Texas Instruments: Pass the Ball
In this activity, students use mathematics to examine patterns that occur in a specific scenario and predict future events for the scenario. Data is collected on the time it takes to pass a ball. The students plot graphs, fit the data...
Texas Instruments
Texas Instruments: Numb3 Rs: Different or Not?
Based off of the hit television show NUMB3RS, this lesson has students examine cancer rates in population samples of the New England states to determine if the states' cancer rates are statistically similar. Hypothesis testing is...
Texas Instruments
Texas Instruments: Testing Goodness of Fit and Two Way Table Chi Square
Students perform chi-square tests to see if data follows a hypothesized distribution. They also study the two-way table analysis.


