National Research Center for Career and Technical Education
Hospitality and Tourism 1: Safety and Sanitation
Math and science come alive in this career-related lesson on sanitation. Along the way, learners explore bacterial growth rates using exponential notation and graphs. A link to a very brief, but vivid video shows just how quickly these...
Google
Surveys and Estimating Large Quantities
Looking for an estimation activity a bit more involved than the typical "guess the number of jellybeans in the jar" game? Here, learners use a picture to estimate the number of people at a large event, look for potential problems with...
Google
The Law of Large Numbers and Probability
Learners investigate why theoretical probability doesn't always match reality. The activity involves using Python 2.7 (or Sage) to set up a Bernoulli Trial. It also involves setting up a spreadsheet to simulate the Birthday Paradox....
Children’s Hospital of Philadelphia
Case Studies: Influenza and HIV
Stop infection spread. Pupils participate in an activity to model infections and replications of viruses. Within the activity, scholars see that viruses may end up with genetic variation and connect that to how some forms of the flu are...
Visa
A Way to Wealth: Understanding Interest and Investments
Money motivates! Help young bankers understand how math plays a part in investing. Give learners math practice while instilling real-world financial literacy skills.
National Research Center for Career and Technical Education
Health Science: Back to Basics
This lesson plan focuses on unit conversion, proportions, ratios, exponents, and the metric system. Discuss measurement with your math class and demonstrate how to solve several health-science word problems. Give learners a chance to...
Massachusetts Institute of Technology
Mit: Open Course Ware: Introduction to Probability and Statistics
The online course consists of educational materials about probability and statistics. Lecture notes, exams, and assignments are included.
National Council of Teachers of Mathematics
The Math Forum: Prob/stat Classroom Materials
This site provides links to lesson plans, example problems, and software sites for probability and statistics.
University of South Florida
Fcat: Drops on a Penny: Teacher Notes
Young scholars learn how to create stem-and-leaf diagrams and boxplots by collecting data on the surface tension of water molecules. This hands-on activity using pennies is a great way to learn how to organize data.
University of Colorado
University of Colorado: Ph Et Interactive Simulations: Plinko Probability
Play Plinko and develop your knowledge of statistics. Drops balls through a triangular grid of pegs and see the balls random walk through the lattice. Watch the histogram of final positions build up and approach the binomial distribution.
University of Colorado
University of Colorado: Ph Et Interactive Simulations: Plinko Probability
Drop balls through a triangular grid of pegs and see them accumulate in containers. Switch to a histogram view and compare the distribution of balls to an ideal binomial distribution. Adjust the binomial probability and develop your...
American Association of Physics Teachers
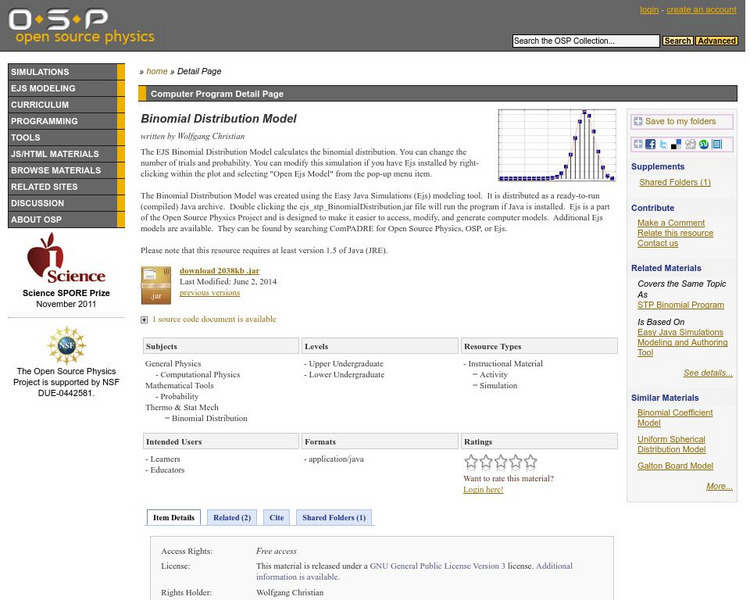
Com Padre Digital Library: Open Source Physics: Binomial Distribution Model
This downloadable mathematics java simulation explores the binomial probability distribution model. The probability and number of trials can be changed to see the effect on the distribution model.
Other
Descriptive Statistics
Very complete explanation of mean, standard deviation, etc. including an online calcluator for these statistics.
Vision Learning
Visionlearning: Statistics: Introduction to Inferential Statistics
An introduction to inferential statistics to find relationships and patterns in datasets.
Math Is Fun
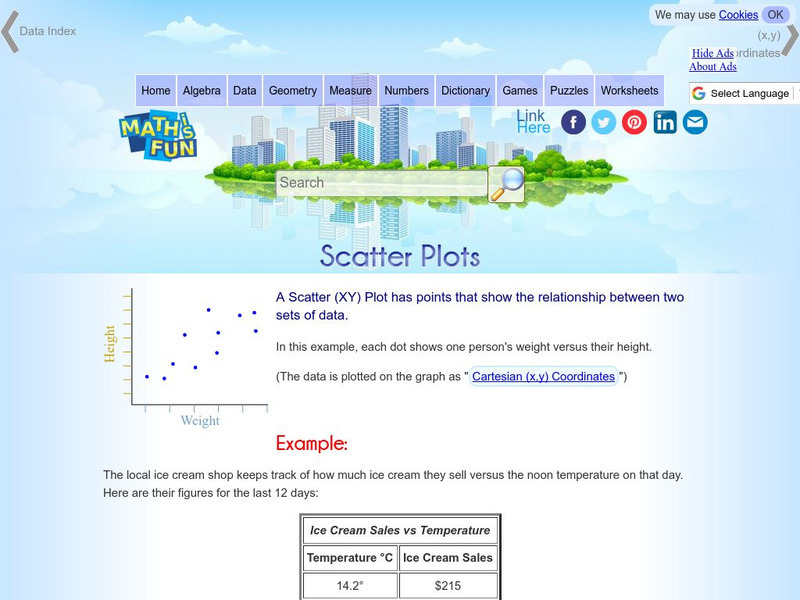
Math Is Fun: Scatter Plots
Explains, with examples, what scatter plots are and how to interpret the data. Discusses trends, interpolation and extrapolation, and correlation. Includes a set of practice questions.
University of Colorado
University of Colorado: Ph Et Interactive Simulations: Least Squares Regression
Create your own scatter plot or use real-world data and try to fit a line to it. Explore how individual data points affect the correlation coefficient and best-fit line.
Vision Learning
Visionlearning: Statistics: Using Mean, Median, and Standard Deviation
An introduction to recognizing trends and relationships in data through descriptive statistics.
Texas Education Agency
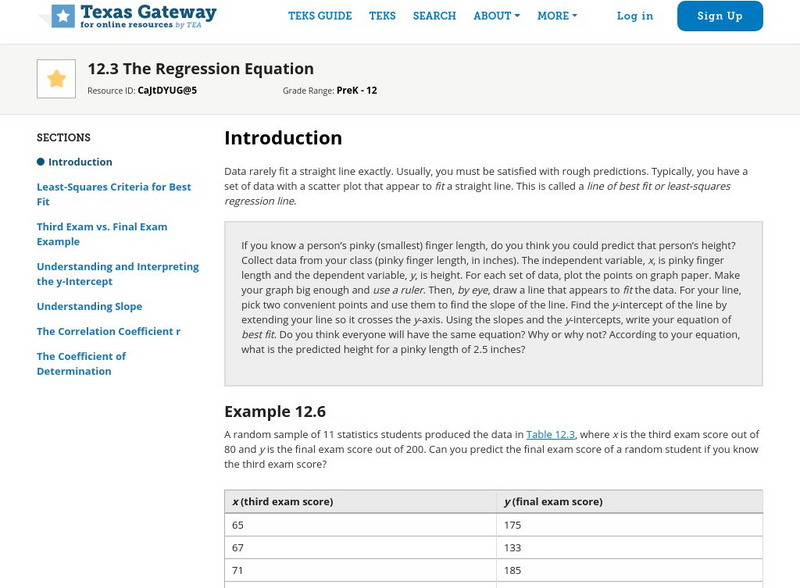
Texas Gateway: Tea Statistics: The Regression Equation
A tutorial on how to find the line of best fit or least-squares regression line for a set of data in a scatter plot using different methods and calculations.
Texas Education Agency
Texas Gateway: Collecting Data and Making Predictions
Given an experimental situation, the student will write linear functions that provide a reasonable fit to data to estimate the solutions and make predictions.
Missouri State University
Missouri State University: Introductory Statistics: T Test: The T Distribution
This discussion of statistical t distributions is presented in notes with examples added as needed.
Missouri State University
Missouri State U.: Introductory Statistics: Concepts, Models, and Applications
This is a comprehensive online text about statistics which covers all the basic concepts.
Math Drills
Math Drills: Statistics and Probability Worksheets
Download these free worksheets to sharpen your skills with statistics and probability. Sheets focus on collecting and organizing data, measures of central tendency (mean, median, mode, and range), and probability.
Cuemath
Cuemath: Scatter Plot
A comprehensive guide for learning all about scatter plots with definitions, how to construct and solve them, types of scatter plots, solved examples, and practice questions.
Houghton Mifflin Harcourt
Holt, Rinehart and Winston: Homework Help Independent Practice: Misleading Graphs and Statistics
Get independent practice working with misleading graphs and statistics. Each incorrect response gets a text box explanation and another try. Correct responses are confirmed.


