Curated by
ACT
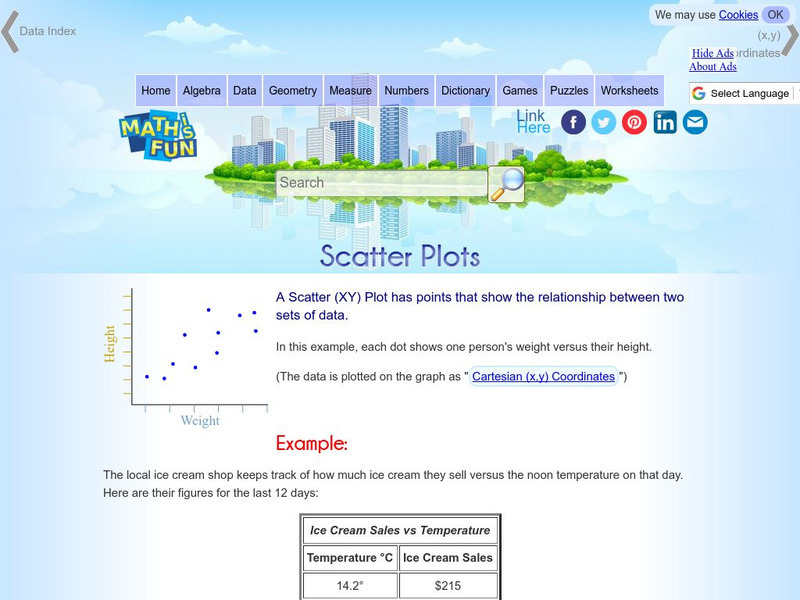
Explains, with examples, what scatter plots are and how to interpret the data. Discusses trends, interpolation and extrapolation, and correlation. Includes a set of practice questions.
3 Views
3 Downloads
CCSS:
Adaptable
Concepts
Additional Tags
Classroom Considerations
- Knovation Readability Score: 2 (1 low difficulty, 5 high difficulty)
- The intended use for this resource is Instructional|practice

