City University of New York
Measures of Variability
Explanation and examples of variance and standard deviation. Helpful charts and formulas are provided.
University of Regina (Canada)
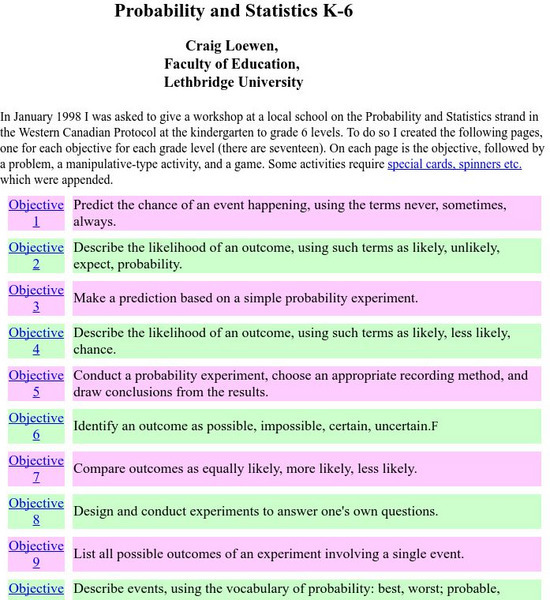
University of Regina: Math Central: Probability and Statistics K 6
A compilation of resources devoted to teaching probability and statistics. The resources are broken into seventeen different objectives that have a problem, activity, and a game.
University of Regina (Canada)
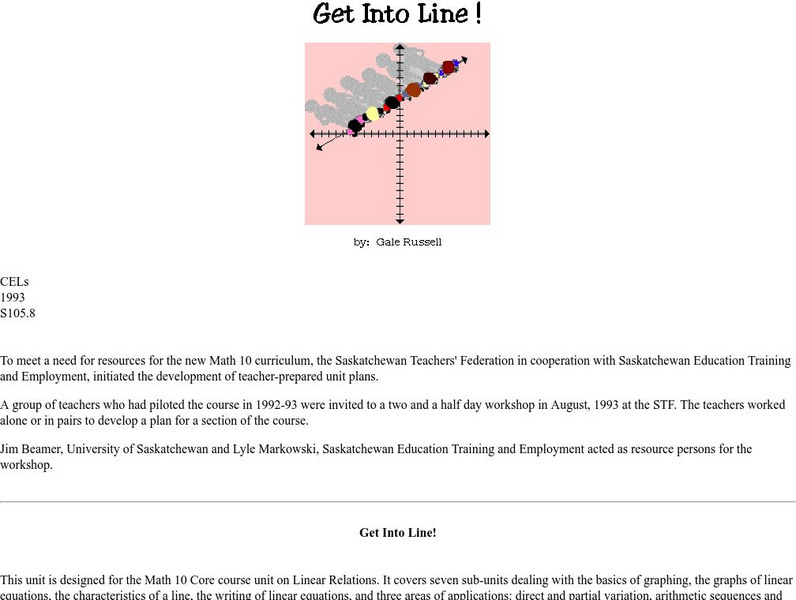
University of Regina: Math Central: Scatter Plots
Three different concepts are examined about scatter plots. Topics featured are collecting data, analyzing scatter plots, and determining a line of "best fit". The lesson has an overview, material, procedures, and evaluation techniques.
Wolfram Research
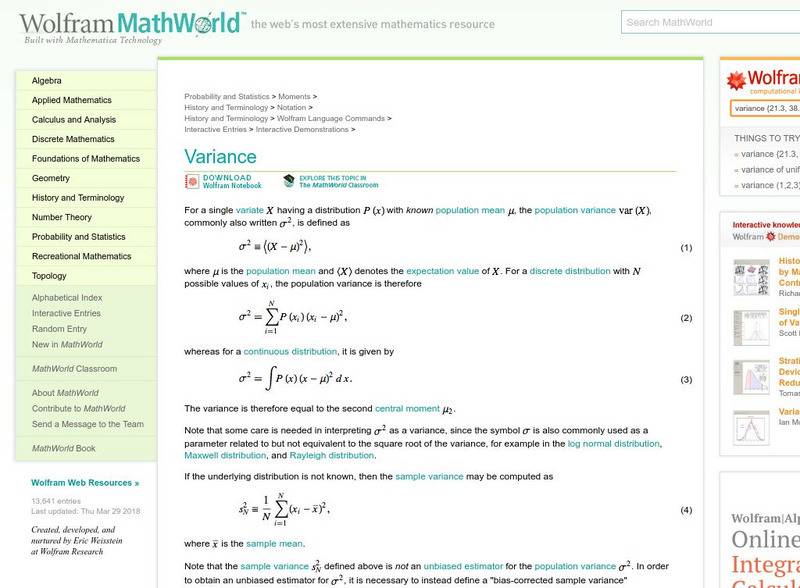
Wolfram Math World: Variance
MathWorld offers a plethora of information on variance. Student should have some statistic knowledge to use this site. This site contains links to related topics.
National Council of Teachers of Mathematics
The Math Forum: Probability and Statistics
This page is a math home page that includes information on all topics of probability and statistics.
Wolfram Research
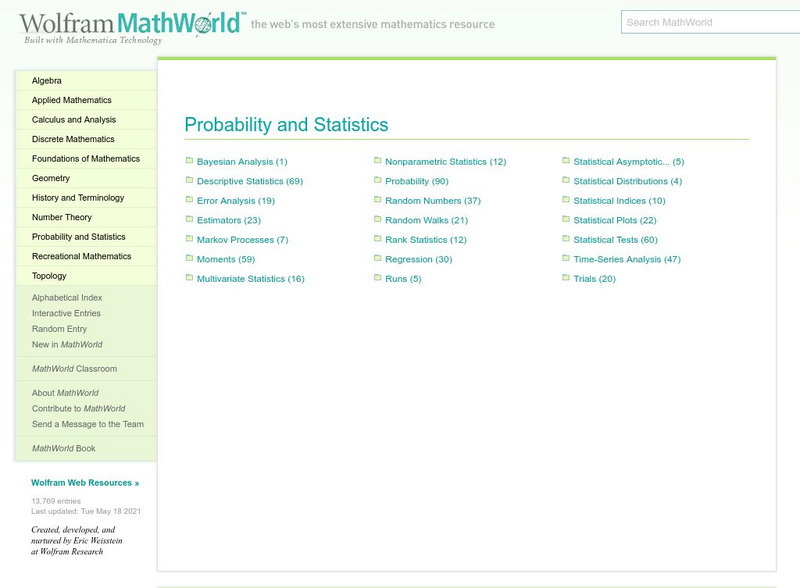
Wolfram Math World: Probability and Statistics
This is a resource for many topics in probability and statistics. Click on the topic of your choice for an explanation. The sites you will be linked to are quite extensive. A degree of higher-level math is necessary for understanding...
Texas Instruments
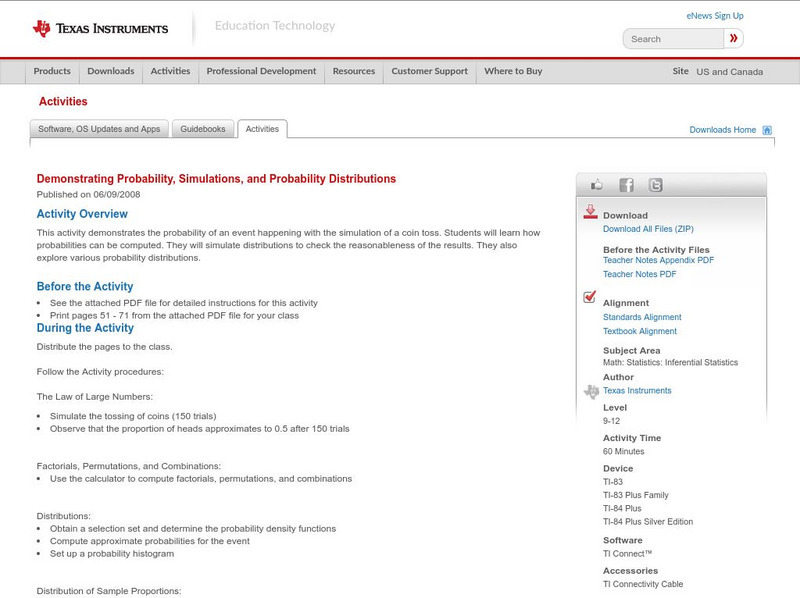
Texas Instruments: Probability, Simulations, and Probability Distributions
Use simulation on the TI-83 graphing calculator to teach students about the distribution of sample proportions, distribution of sample means, the Central Limit Theorem, normal probability plots, and the Law of Large Numbers. Pick and...
Texas Instruments
Texas Instruments: Pass the Ball
In this activity, students use mathematics to examine patterns that occur in a specific scenario and predict future events for the scenario. Data is collected on the time it takes to pass a ball. The students plot graphs, fit the data...
Texas Instruments
Texas Instruments: Statistics
In this activity, students use the statistical features of the calculator to calculate statistical results, perform regressional analyses, and graphically display statistical data.
Texas Instruments
Texas Instruments: Line of Best Fit
In these questions, students will find the linear equation of best fit for a set of data and interpret the correlation coefficient. Questions are multiple-choice and true/false; solutions are provided.
Texas Instruments
Texas Instruments: Statistics Pretest
This is a pre-test for a statistics class. Since most systems want data driven analysis, this is a great way to get data at the beginning of the course on how much students know about statistics.
Texas Instruments
Texas Instruments: Statistics for Math B
Students will determine the mean, median, mode and standard deviation of collected data. They will make a frequency histogram of the grouped data, both on graph paper, and on the TI 83+.
Texas Instruments
Texas Instruments: Probability Simulations App
This App allows students to explore probability theory with interactive animation that simulates rolling dice, tossing coins, and generating random numbers. They use evaluation options such as bar graphs and table of trials data....
Texas Instruments
Texas Instruments: Mc Dougal Littell Algebra 1: Graphing a Scatter Plot
Students will make a scatter plot and explore any patterns.
Stefan Warner and Steven R. Costenoble
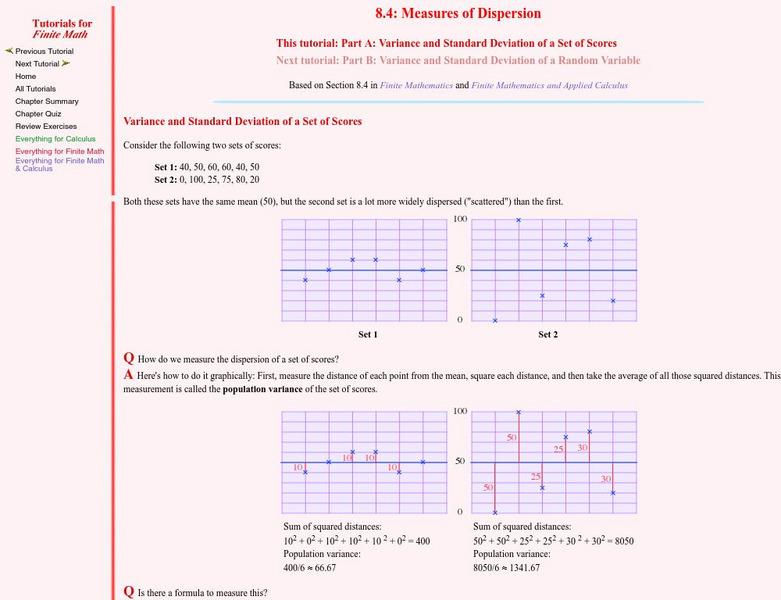
Finite Mathematics & Applied Calculus: Variance and Standard Deviation of a Set of Scores
Students learn about the variance and standard deviation of a set of scores. Topics explored are the empirical rule and Chebyshev's rule. The tutorial investigates the statistics concepts through class notes and examples. Review...
Stefan Warner and Steven R. Costenoble
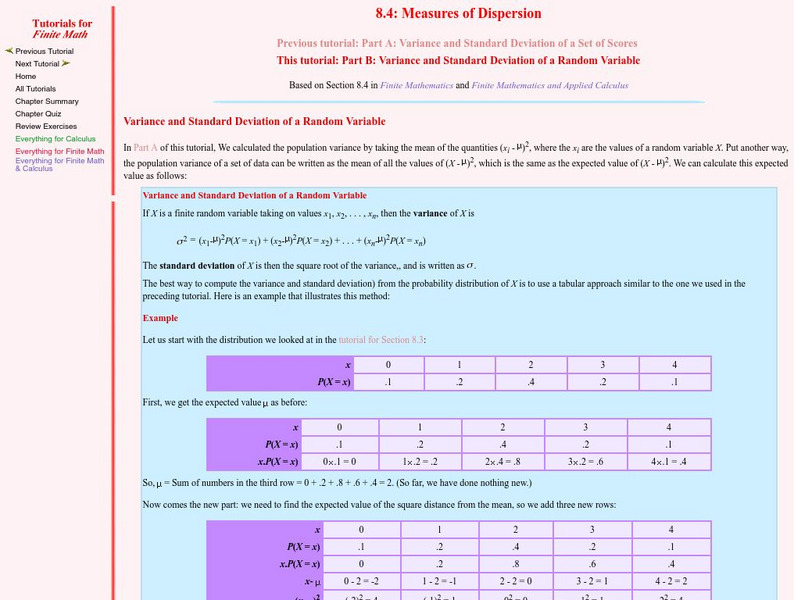
Finite Mathematics & Applied Calculus: Variance and Standard Deviation of a Random Variable
Students learn about the variance and standard deviation of a random variable. The tutorial investigates the statistics concepts through class notes and examples. Review exercises and a chapter quiz are included.
Stefan Warner and Steven R. Costenoble
Finite Mathematics & Applied Calculus: Mean, Median & Standard Deviation
Students learn about mean, median, variance, and standard deviation. The tutorial investigates the statistics concepts though class notes and examples. Review exercises are included.
Stefan Warner and Steven R. Costenoble
Finite Mathematics & Applied Calculus: Topic Summaries: Statistics
The topic summary outlines random variables and statistics. Some topics reviewed are normal distribution, Bernoulli trials, measures of central tendency, and variance. The resource consists of definitions, notes, and examples.
Stefan Warner and Steven R. Costenoble
Finite Mathematics & Applied Calculus: Review Exercises: Random Variables and Statistics
Students review random variables and statistics. The resource consists of review exercises on the mathematics concepts.
Stefan Warner and Steven R. Costenoble
Finite Mathematics & Applied Calculus: Quiz: Random Variables and Statistics
The online quiz assesses student comprehension of math concepts. The quiz consists of true/false questions about random variables and statistics.
Math Is Fun
Math Is Fun: Standard Normal Distribution Table
An explanation of standard normal distribution along with a table of values.
Ministry of Education and Universities of the Region of Murcia (Spain)
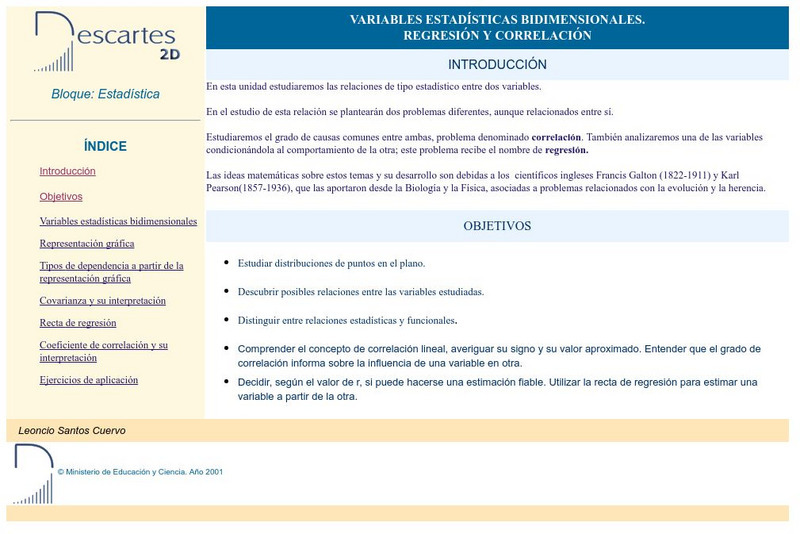
Ministerio De Educacion Y Ciencia: Variable Estadisticas Bidimensionales
In Spanish. This interactive unit shows you the statistical relationship between two variables.


