CK-12 Foundation
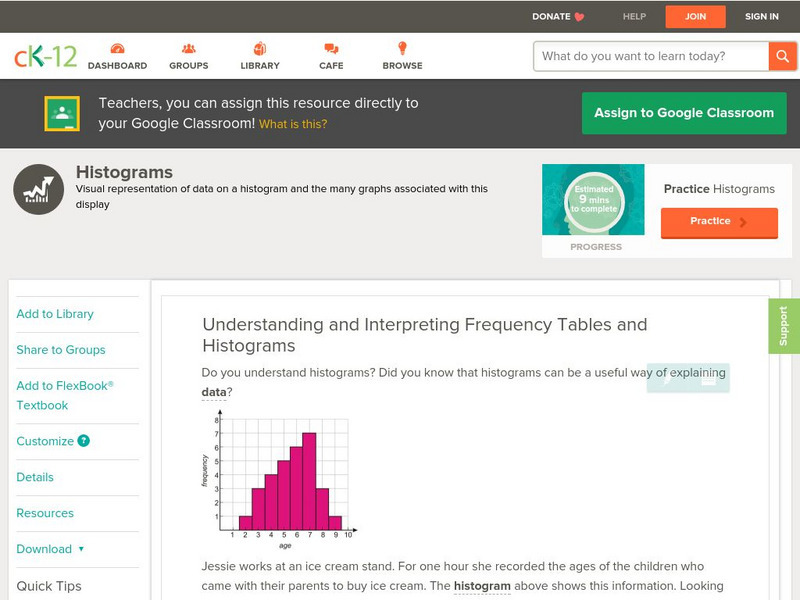
Ck 12: Statistics: Histograms Grade 8
[Free Registration/Login may be required to access all resource tools.] Students will interpret frequency tables and connect data to histograms.
CK-12 Foundation
Ck 12: Statistics: Mean Grades 9 10
[Free Registration/Login may be required to access all resource tools.] Find the mean of a set of data.
CK-12 Foundation
Ck 12: Statistics: Multiple Line Graphs
[Free Registration/Login may be required to access all resource tools.] Make multiple line graphs to display and compare given data.
Other
Webopedia: Tape
Resource offers several paragraphs of information on tapes, which are magnetically coated strips of plastic on which data can be encoded.
Scholastic
Scholastic: Study Jams! Math: Data Analysis: Line Plots
Explore how to organize and plot data on a line plot by going step by step through the activity. Then test your knowledge to check for understanding.
National Center for Ecological Analysis and Synthesis, University of California Santa Barbara
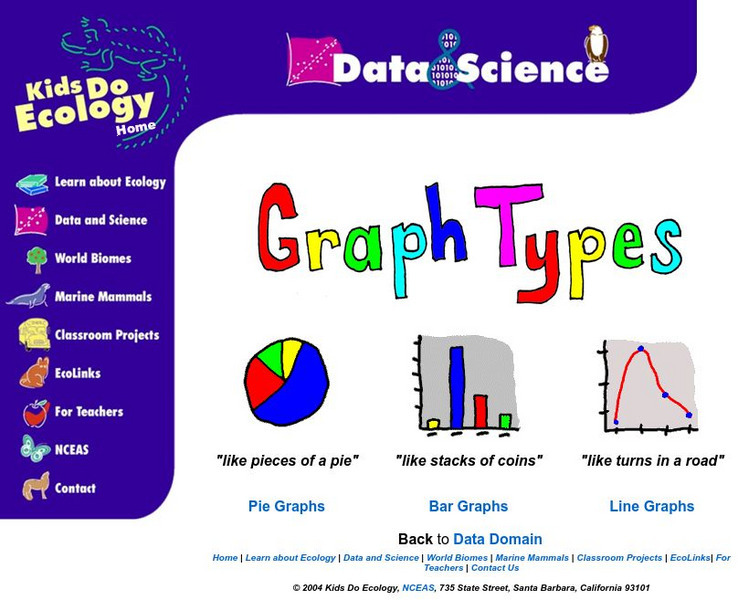
Nceas: Graph Types
At this site from NCEAS you can learn how to organize your data into pie graphs, bar graphs, and line graphs. Explanations and examples are given of each graph along with several questions that check comprehension.
Oswego City School District
Regents Exam Prep Center: Multiple Choice Practice: Working With Data
Test your knowledge of working with data by taking this twenty question multiple-choice practice test. Use a graphing calculator to help with any graphing problems and check your answers at any given time throughout the test.
University of Waterloo (Canada)
Wired Math: Organizing Data Grade 7 [Pdf]
A collection of worksheets that focus on data analysis and organizing data. Includes detailed examples, colorful visuals, and a link to a related game. Acrobat Reader required.
Goodwill
Gcf Global: Google Sheets
In this tutorial, learn how to use the powerful tools in Google Sheets for organizing, visualizing, and calculating data in a spreadsheet.
Goodwill
Gcf Global: Excel Tips
Learn these Excel tips and tricks so you can do more with this popular spreadsheet program.
University of Cambridge
University of Cambridge: Maths and Sports: Olympic Records
Can you work out which Olympics athletics event each anonymised graph of Olympic records data represents? This activity, aimed at Key Stage 3 (age 11-14), gives students the opportunity to make sense of graphical data and challenges them...
University of Cambridge
University of Cambridge: Maths and Sports: Match the Matches
Decide which charts and graphs represent the number of goals two football teams scored in fifteen matches. This data handling activity is designed to get children talking meaningfully about mathematics, presenting and justifying...
Illustrative Mathematics
Illustrative Mathematics: S Id Haircut Costs
This lesson could be used as an introductory lesson to introduce group comparisons. Being able to use data to compare two groups is an important skill. Students will sketch box plots using the data given about the cost of haircuts for...
Illustrative Mathematics
Illustrative Mathematics: S Id Math Test Grades
Ari has collected data on how much her classmates study each week and how well they did on their recent math test. Here is part of the data showing the percentage of each group (divided according to hours spent studying) who got B's or...
Illustrative Mathematics
Illustrative Mathematics: S Id.6 Used Subaru Foresters
Help Jane sell her Forrester! Using the data given, students will make an appropriate plot with well-labeled axes that would allow you to see if there is a relationship between price and age and between price and mileage. Students are...
Illustrative Mathematics
Illustrative Mathematics: S Id, F if Laptop Battery Charge
This task uses a situation that is familiar to students to solve a problem they probably have all encountered before: How long will it take until an electronic device has a fully charged battery? Given data, students perform a variety of...
Illustrative Mathematics
Illustrative Mathematics: S Id Coffee and Crime
This task addresses many standards regarding the description and analysis of bivariate quantitative data, including regression and correlation. Given a scatter plot, students will answer a variety of questions about linear relationships,...
Illustrative Mathematics
Illustrative Mathematics: Color Week
Five-year-olds need to count things that relate to them. This activity builds on their need to be included or see the relevance of their counting. Students will practice counting, writing numbers, and filling in a chart or bar graph....
Success Link
Success Link: Fruit Loops Graphs
A lesson plan on graphing for young learners that can be adapted for older elementary students too. Use Fruit Loops for providing data that can be expressed in many different graphs.
Success Link
Success Link: Jump! Jump!
A lesson plan that expects students to make accurate measurements of long jumps and record the information. It makes suggestions of how to make this a fun, competitive schoolwide program.
Illustrative Mathematics
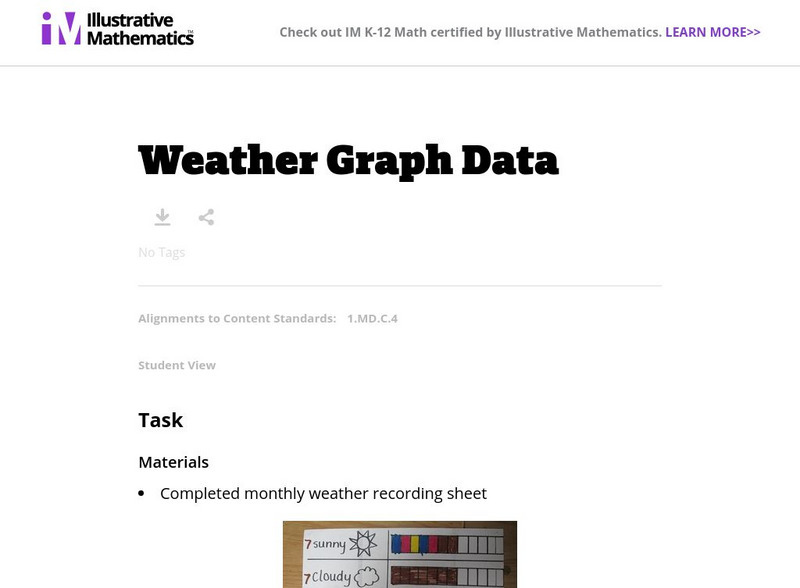
Illustrative Mathematics: Weather Graph Data
The purpose of this task is for students to represent and interpret weather data, as well as answer questions about the data they have recorded. Student worksheets and recording sheet are included.
Khan Academy
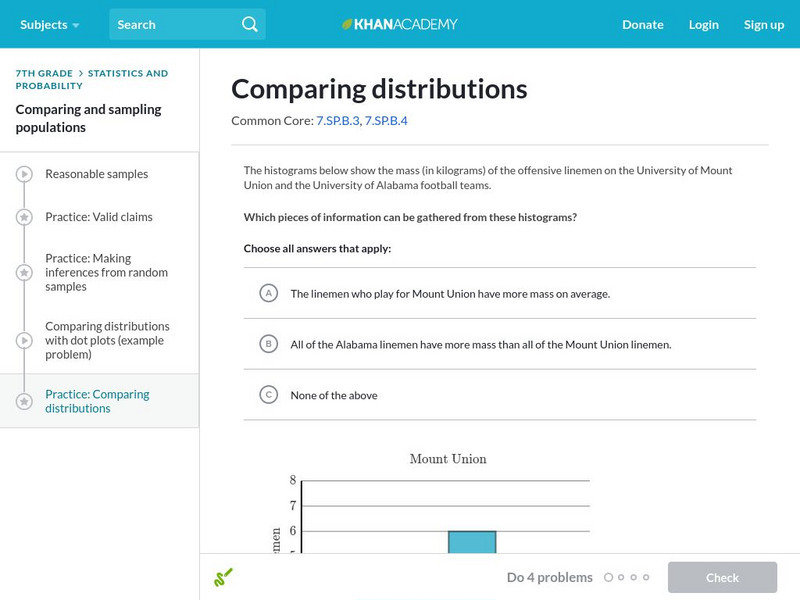
Khan Academy: Comparing Distributions
Try these practice problems comparing distributions.
Khan Academy
Khan Academy: Read Line Plots (Data With Fractions)
Practice reading and interpreting data that is graphed on line plots. The data graphed includes fractions. Students receive immediate feedback and have the opportunity to try questions repeatedly, watch a video or receive hints....


![Wired Math: Organizing Data Grade 7 [Pdf] Activity Wired Math: Organizing Data Grade 7 [Pdf] Activity](https://d15y2dacu3jp90.cloudfront.net/images/attachment_defaults/resource/large/FPO-knovation.png)


