Curated OER
Go Fish
Help learners discover methods to estimate animal population. They will participate in a simulation of catching and tagging fish in order to estimate the fish population. They scoop and count goldfish crackers, record data, and use...
Curated OER
States Of Matter
Delv into the states of Matter. Students engage in the scientific inquiry process to uncover the exciting world of Matter. They watch a series of videos, and conduct experiments in order to collect and analyze data on the various state...
Curated OER
On the Trail of the Hudson's Migratory Fish
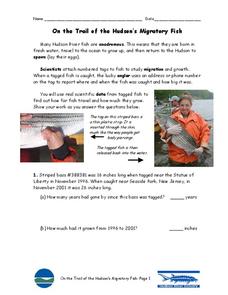
Ever wonder how scientists track fish underwater? Your class can learn how with this informative instructional activity. First, they will read a paragraph about androgynous fish, tagging, and data analysis. Then, your scientists must...
K20 Learn
Bavaria Has Issues...Experimental Components
Do you want to be a detective by analyzing situations? An engaging lesson provides young historians with the tools to help them understand the difference between data types and how to analyze them to draw conclusions. Scholars complete...
US Department of Energy
Thermal Expansion of Water: Rise of Sea Level
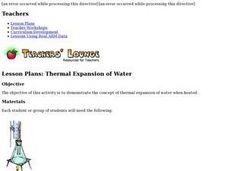
Using bunsen burners, Erlenmeyer flasks, thermometers, hollow glass tubes, stoppers, and rulers, learners experiment with and measure how water expands when heated. The activity connects the expansion of water when heated to global...
University of Minnesota
Makes Me Sweat
Never let them see you sweat ... unless you can't help it! Scholars design an experiment to determine the effects of stress on the body. They monitor sweat production under different conditions and relate the response to the function of...
Anti-Defamation League
60 Years Later: The Legacy of Brown v. Board of Education
Although the 1954 U.S. Supreme Court decision Brown v. Board of Education declared segregated schools unconstitutional, huge inequalities still exist in U.S. public schools. Learners analyze and discuss data presented in two...
Curated OER
Open Inquiry Using C. elegans
Ever wondered what motivates a roundworm? Introduce your biology class to C. elegans, a non-parasitic model organism that can help them understand behavioral stimuli. Paired pupils design an experiment to test the worm's reaction to...
Curated OER
Go Fish!
So much science in one tiny fish! Introduce young biologists to the zebrafish, a common aquarium inhabitant. The small, unassuming organism presents an opportunity for learners to study habituation using an easy-to-care-for species. Lab...
Curated OER
Fishy Behavior
Here's a lab that may make you rethink that morning cup of coffee. Biology scholars test the effects of caffeine, alcohol, and nicotine on the behavior of zebrafish through an intriguing experiment. Learners observe fish...
K20 LEARN
The Parched Plains: Weather And Climate
How do meteorologists differentiate between droughts and dry spells? Introduce the concepts of weather forecasting and prediction with an insightful research-based lesson from the K20 series. Partners synthesize individual research from...
K20 LEARN
You’re The Network: Data Analysis
How do you rate? Young scholars use graphical data to analyze ratings of different television episodes. Their analyses include best-fit lines, mean, median, mode, and range.
K20 LEARN
Transpiring Trees: Plant Transpiration and the Water Cycle
Looking for a tree-rific addition to your water cycle unit? Teams of young foresters examine the role of transpiration in the water cycle through a week's worth of activities. Pupils analyze how trees take in and transport water during...
Beyond Benign
Solubility
Enhance your class' ability to understand solubility. Science scholars examine how temperature and concentration affect solubility using an interesting lab experiment. The introduction and procedure also discuss the relationship between...
Beyond Benign
Decision Graphic Introduction
E is for economics, environment, and social equity. The fifth installment of a 15-part series has scholars first considering ecological impacts, such as determining how much water it takes to produce a can of soda. They then use decision...
NASA
Using Models in Climate Change Research
Explore models through the relevant lens of climate change! Investigators watch a video about using models and their application for evaluating temperature data and climate change. Scientists read an article on climate change and answer...
NASA
Data Literacy Cube: Global Atmospheric Temperature Anomaly Data
Evaluate global temperature anomalies using real-world data from NASA! Climatologists analyze a data set using a literacy cube and differentiated question sheets. Team members evaluate global temperature anomaly data with basic...
NASA
Introduction: Building Claims from Evidence
Making a claim without supporting it has little value. Learners work on their claim-making skills in a well-designed lesson. They view still images from a video and make claims using support from the visual representations. They then...
Facebook
Metadata
In previous lessons, young journalists learned about how to trace the original source of scrapes and memes. This interactive lesson plan teaches them another important step in the verification process. Participants learn how to analyze...
American Statistical Association
Who Has the Longest First Name?
Name that statistic! Classmates each write their name and the number of letters in it on a sticky note to place on the board. As a class, they determine the median, mode, and range of the name lengths, and create a dot plot of the data....
American Statistical Association
A Tale of One City and Two Lead Measurements
Lead the way in learning about lead contamination. Pupils first read several articles about the Flint water crisis and the EPA's rules for lead concentration. They use provided data from 71 Flint water wells to compute the 90th...
American Statistical Association
How Long Are the Words in the Gettysburg Address?
It's 268 words, but one only needs to consider 10 of them at a time. A data collection and analysis activity has learners investigate the lengths of words in the Gettysburg Address. They first self-select a sample of 10 words and...
PBS
Curious George: Graphing
After watching an engaging video where Curious George gets to play librarian for the day, sorting books, scholars sort information and graph their data. Learners move from concrete to picture to abstract graphing and analyze...
Workforce Solutions
Miniature Gulf Coast Project
Scholars show what they know about data collection and analysis with an activity that examines a smaller population of Houghton, Texas. Independently or in pairs, learners identify their research question, gather, graph, and analyze...


