NASA
Developing an Investigation
Watch as your class makes the transition from pupils to researchers! A well-designed lesson has scholars pick a solar wind characteristic to research. They then collect and analyze official data from the LANL website. This is the third...
Towson University
Case of the Crown Jewels
Can your biology class crack the Case of the Crown Jewels? Junior forensics experts try their hands at DNA restriction analysis in an exciting lab activity. The lesson introduces the concept of restriction analysis, teaches pipetting and...
Cornell Lab of Ornithology
Investigating Evidence
Explore the scientific process through nature. Scholars become scientists as they develop a question, design an experiment, collect data, and analyze their results. A two-week lesson guides your classes through the process and provides...
University of Minnesota
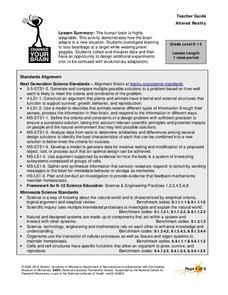
Altered Reality
Fascinate young life scientists by showing them how their brain learns. By using prism goggles while attempting to toss bean bags at a target, lab partners change their outlook on the world around them, producing amusing results....
EngageNY
Presenting a Summary of a Statistical Project
Based upon the statistics, this is what it means. The last instructional activity in a series of 22 has pupils present the findings from their statistical projects. The scholars discuss the four-step process used to complete the project...
EngageNY
Posing Statistical Questions
Is this a statistical question? The opening lesson in a series of 22 introduces the concept of statistical questions. Class members discuss different questions and determine whether they are statistical or not, then they sort the data...
EngageNY
Estimating Probabilities by Collecting Data
Take a spin to determine experimental probability. Small groups spin a spinner and keep track of the sums of the spins and calculate the resulting probabilities. Pupils use simulated frequencies to practice finding other probabilities to...
Chicago Botanic Garden
Preparing for Project BudBurst
Plants take cues from the environment—change in daylight hours and temperature—to complete their seasonal life cycles. Lesson four in the series of six has classes collect phenology data on plants. After taking initial observations,...
Chicago Botanic Garden
Preparing for Project BudBurst
Male deer growing antlers to begin the breeding season is an example of a phenological event. First in a four-part series is an activity requiring individuals to collect phenological data on their campus. Classes discuss phenology, the...
American Statistical Association
How Tall and How Many?
Is there a relationship between height and the number of siblings? Classmates collect data on their heights and numbers of brothers and sisters. They apply statistical methods to determine if such a relationship exists.
Radford University
A Change in the Weather
Explore the power of mathematics through this two-week statistics unit. Pupils learn about several climate-related issues and complete surveys that communicate their perceptions. They graph both univariate and bivariate data and use...
American Statistical Association
An A-MAZE-ING Comparison
Teach your class how to use descriptive statistics through a hands-on data collection activity. Pupils collect their own data, calculate test statistics, and interpret the results in context. They compare male and female results, looking...
Statistics Education Web
It Creeps. It Crawls. Watch Out For The Blob!
How do you find the area of an irregular shape? Class members calculate the area of an irregular shape by finding the area of a random sampling of the shape. Individuals then utilize a confidence interval to improve accuracy and use a...
Statistics Education Web
When 95% Accurate Isn’t
Investigate the effect of false positives on probability calculation with an activity that asks scholars to collect simulated data generated by a calculator. To finish, participants analyze the probability of certain outcomes which lead...
Statistics Education Web
Walk the Line
How confident are you? Explore the meaning of a confidence interval using class collected data. Learners analyze data and follow the steps to determine a 95 percent confidence interval. They then interpret the meaning of the confidence...
Statistics Education Web
How High Can You Jump?
How high can your pupils jump? Learners design an experiment to answer this question. After collecting the data, they create box plots and scatter plots to analyze the data. To finish the instructional activity, they use the data to...
Statistics Education Web
What Does the Normal Distribution Sound Like?
Groups collect data describing the number of times a bag of microwave popcorn pops at given intervals. Participants discover that the data fits a normal curve and answer questions based on the distribution of this data.
American Statistical Association
Colors Challenge!
Does writing the name of a color in a different colored ink affect one's ability to read it? Scholars design an experiment to answer this question. They collect the data, analyze the statistics, and draw a conclusion based on what they...
Messenger Education
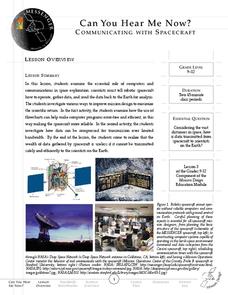
Can You Hear Me Now?—Communicating with Spacecraft
Radio signals transmitted to Pluto take five hours to reach their destination! In these two activities, young scientists explore data communication in space. In activity one, pupils learn how data is gathered and sent back to Earth....
US Department of Agriculture
Sink or Float?
Will it sink or will it float? Learners predict the outcome as they drop random objects into a container of water. Then, they keep track of the results and record the data in a t-chart to draw a final conclusion.
Bowland
My Music
Scholars investigate how the tempo of music affects heartbeats. Groups develop hypotheses about music and its connection to heartbeats before carrying out an experiment. They analyze and present data from their investigations.
Bowland
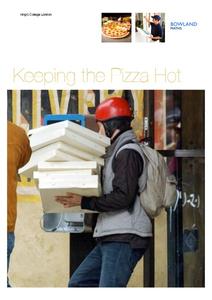
Keeping the Pizza Hot
Learners conduct an experiment to develop a cooling curve for pizza. They consider how this affects pizza delivery in terms of packing material, distance, and delivery routes.
Bowland
Fashionista
So trendy! Show your class how to identify trends in sales patterns using mathematics. Scholars use a software simulation to collect data on age groups, price, and sales at a fashion store. This data allows individuals to determine the...
Bowland
Crash Test
Use mathematics and simulations to investigate car crashes. IScholars test hypotheses involving car crashes. They collect, analyze, and display data from computer simulations to support or refute their hypotheses.


