Curated OER
Data Handling: Pictogram of Birds
In this pictograph problem solving worksheet, students analyze a pictograph of birds seen each day for a week. They use the information on the graph to solve 6 problems.
Curated OER
Data Handling: Tally Chart on Illnesses
In this tally chart worksheet, students analyze a chart showing childhood illness cases. Students use the tally chart to solve 6 problems.
Curated OER
Tally Chart: Favorite Names
In this data display worksheet, students analyze a tally chart of favorite hamster names. Using the information on the chart, students solve 8 word problems.
Curated OER
Data Handling: Bus Charts
In this data display and analysis worksheet, students study a bar graph that shows the number of people who ride the bus at different times of day. Students use the graph to solve 6 problems. Note: Bus times are shown in 24 hour clock time.
Curated OER
Data Handling: Bar Chart Showing Frequency
In this bar graph worksheet, students analyze a bar graph showing soccer goals scored. Students then use the data to solve 7 problems.
Curated OER
Seized Before Flights: Graph
In this bar graph worksheet, students analyze a graph that show the number of prohibited items intercepted at U.S. airport screening checkpoints. Students answer 3 problem solving questions about the data on the graph.
Curated OER
Data Handling
In this data handling worksheet, 6th graders solve and complete 4 various types of problems. First, they draw a bar chart to represent the information provided in the table shown. Then, students show beneath the table how to work out the...
Curated OER
Learning to Make Data Tables
Students construct data tables using the results of previous experiments. In this graphing lesson, students plot data and interpret the results. Students discuss how they organized their data.
Curated OER
Bar Graph- Calories In Fast Food Items
In this bar graph worksheet, learners analyze a bar graph that shows calories in 10 fast food menu items. Students answer 7 questions about the graph.
Curated OER
Making A Horizontal Bar Graph
In this bar graph instructional activity, students create a bar graph to display 6 scores from basketball games. Students will label the x and y axis and correctly plot the scores from the table provided.
Curated OER
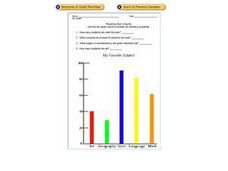
Reading Bar Graphs: My Favorite Subject
In this bar graphs worksheet, learners analyze a bar graph about favorite school subjects. Students use the information on the graph to answer 7 questions.
Curated OER
Tenths
In this fractions and decimals worksheet, students analyze a data table about painting playground fence posts. Students solve 6 story problems in which a fraction and a decimal are converted.
Curated OER
Two Ways to Solve
For this data table worksheet, students solve 4 word problems using the information on a data table about raffle tickets sold by 5 students.
Curated OER
Range and Mode Reteach 4.5
In this range and mode worksheet, students analyze the data table and graph that show numbers of books read. Students use the data to answer 4 questions.
Curated OER
Regroup Ones and Tens
In this problem solving instructional activity, students analyze the information on a data table about the sizes of bears. Students use the table to solve 4 problems in which addition with regrouping twice is used.
Curated OER
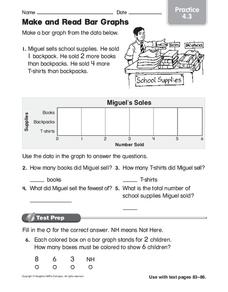
Make and Read Bar Graphs
In this bar graphs worksheet, students make a bar graph about the sale of school supplies with the data presented in one story problem.
Curated OER
Read a Pictograph
In this data display worksheet, learners solve 4 problems in which data on a tally chart and pictograph are analyzed. Students use this information to solve the problems.
Curated OER
Where do Plants Get their Food?
In this where do plants get their food worksheet, students design an experiment that will disprove the idea that plants obtain their food from soil. Students will set up their experiment and design a data table that will record data over...
Curated OER
Speed and Experiments
In this speed formula and scientific method worksheet, students read over descriptions of the formula an method. Students then respond to 12 matching, problem solving and short answer questions.
Curated OER
Toy Sale- Writing Number Sentence and Using a Data Table Enrichment Worksheet
In this number sentence and data table enrichment worksheet, 1st graders write a number sentence using information from a data table to solve an equation in 4 examples.
Curated OER
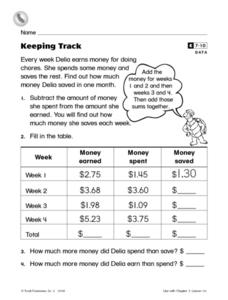
Keeping Track
In this data table worksheet, students complete a table with information on money earned, spent and saved in each of 4 weeks for a student's job.
Curated OER
Watch the Birdie
In this data table worksheet, students solve 6 word problems in which information about birds on a data table is used to answer each question.
Curated OER
Making a Bar Graph
In this bar graph worksheet, students analyze a data table and bar graph depicting information about stickers collected. Students answer 5 questions about the data displayed.
Curated OER
Line Graphs
In this line graphs worksheet, 8th graders solve and complete 10 different problems that include various line graphs. First, they use each line graph shown to respond to the questions that follow regarding books and population. Then,...


