West Contra Costa Unified School District
Correlation and Line of Best Fit
Computers are useful for more than just surfing the Internet. Pupils first investigate scatter plots and estimate correlation coefficients. Next, they use Microsoft Excel to create scatter plots and determine correlation...
Curated OER
Prescient Grading
Do homework grades really determine test scores? Learn whether lines of best fit, correlation coefficients, and residuals can be used to determine test scores when given homework grades. (It would certainly save teachers time in grading...
EngageNY
Modeling a Context from Data (part 2)
Forgive me, I regress. Building upon previous modeling activities, the class examines models using the regression function on a graphing calculator. They use the modeling process to interpret the context and to make predictions...
EngageNY
Interpreting Correlation
Is 0.56 stronger than -0.78? Interpret the correlation coefficient as the strength and direction of a linear relationship between two variables. An algebra lesson introduces the correlation coefficient by estimating and then...
EngageNY
End-of-Module Assessment Task - Algebra 1 (Module 2)
Check for understanding at the end of your descriptive statistics unit with an end-of-module assessment. It uses five questions to measure progress toward mastery of descriptive statistics standards. Each question is developed...
Curated OER
Linear and Exponential Models
Students investigate the differences between linear and exponential models. In this linear and exponential models lesson plan, students make a table of given data. Students determine if the data is linear or exponential by...
Curated OER
Correlation
High schoolers investigate correlation coefficients. In this correlation coefficient lesson, students explore correlation coefficient calculations. High schoolers research independently by collecting data, calculating the correlation...
University of Hawai'i
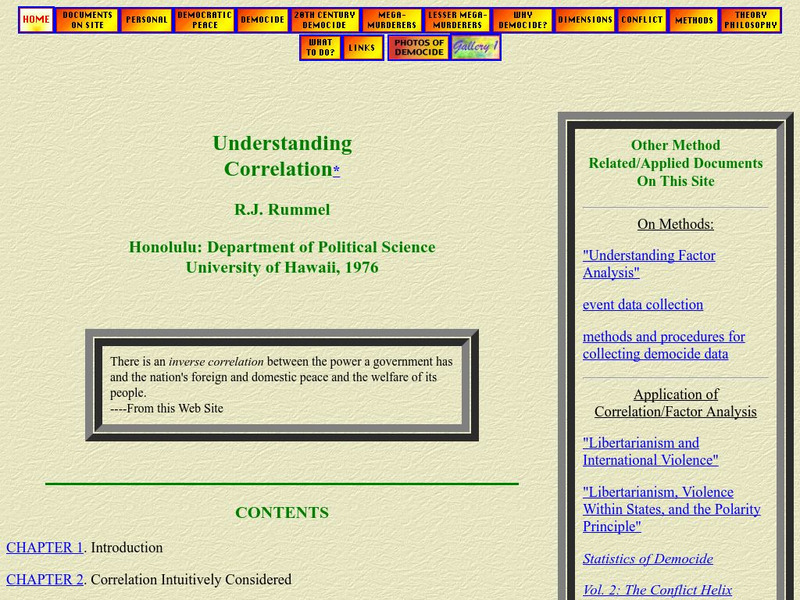
University of Hawaii: Understanding Correlation
This page gives a lot of information on correlation, including a section on the coefficient of correlation.
Annenberg Foundation
Annenberg Learner: Against All Odds: Inside Statistics: Correlation
Twin studies track how similar identical and fraternal twins are on various characteristics, even if they don't grow up together. Correlation lets researchers put a number on it. Scroll down the page to find comprehensive student and...
University of Colorado
University of Colorado: Ph Et Interactive Simulations: Least Squares Regression
Create your own scatter plot or use real-world data and try to fit a line to it. Explore how individual data points affect the correlation coefficient and best-fit line.
Texas Education Agency
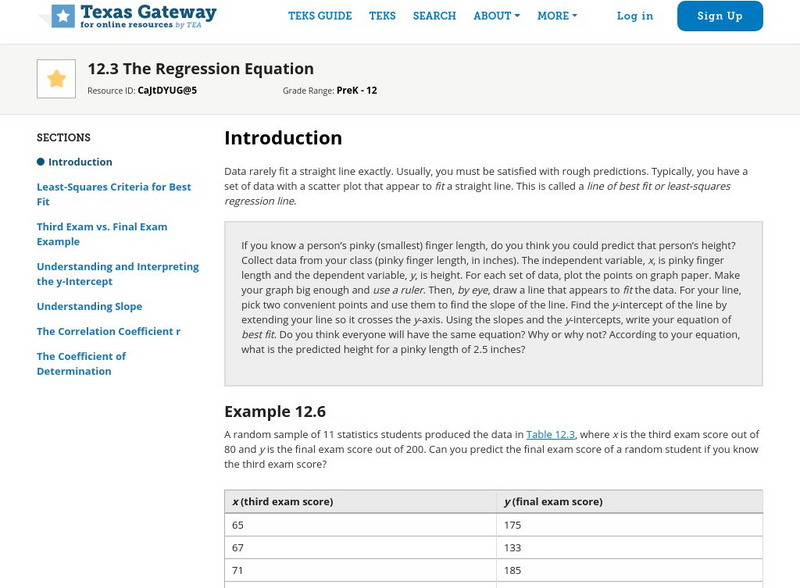
Texas Gateway: Tea Statistics: The Regression Equation
A tutorial on how to find the line of best fit or least-squares regression line for a set of data in a scatter plot using different methods and calculations.
Texas Education Agency
Texas Gateway: Collecting Data and Making Predictions
Given an experimental situation, the student will write linear functions that provide a reasonable fit to data to estimate the solutions and make predictions.
BSCS Science Learning
Bscs: Budburst Lilac Festival
For this Inquiry, students predict the best date to host a lilac blossom festival so that lilacs are in full bloom in the city where students live. Students are introduced to Project Budburst, a citizen science project in which...
McGraw Hill
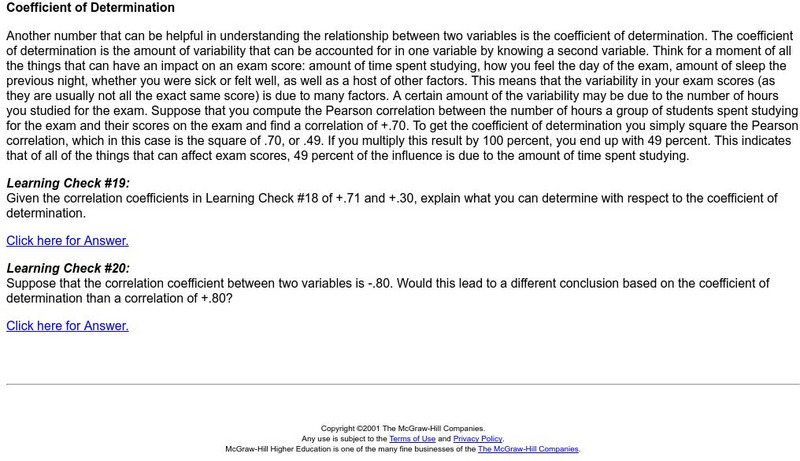
Mc Graw Hill : Coefficient of Determination
An explanation of the coefficient of determination from the social science perspective. Includes two practice problems and their solutions.
Texas Instruments
Texas Instruments: Scatterplots and Correlation With Ti 89
Students input data relating the values of one variable associated with values of another and use these data to generate a scatterplot. From the scatterplot, they determine whether there is a correlation between the two variables and...
National Council of Teachers of Mathematics
Nctm: Illuminations: Linear Regression 1
An interactive program where students will explore regression lines. Students will be introduced to the correlation coefficient and come to understand what it represents through the given exploration. Requires Java.
Texas Instruments
Texas Instruments: Identifying Types of Correlation From a Graph and Calculator
Students will identify different types of correlations graphically and by using the linear regression analysis obtained from a TI-84 Plus calculator. Students will also obtain and know the significance of a correlation coefficient as a...
Wolfram Research
Wolfram Math World: Correlation Coefficient
This is an elaborate site pertaining to the Correlation coefficient. The site begins with a brief introduction to what the correlation coefficient represents then goes into detail on how to find this value. The site has many links and...
Wolfram Research
Wolfram Math World: Correlation Coefficient
MathWorld offers a technical, yet informative, explanation of the correlation coefficient for bivariate normal distribution.
Texas Instruments
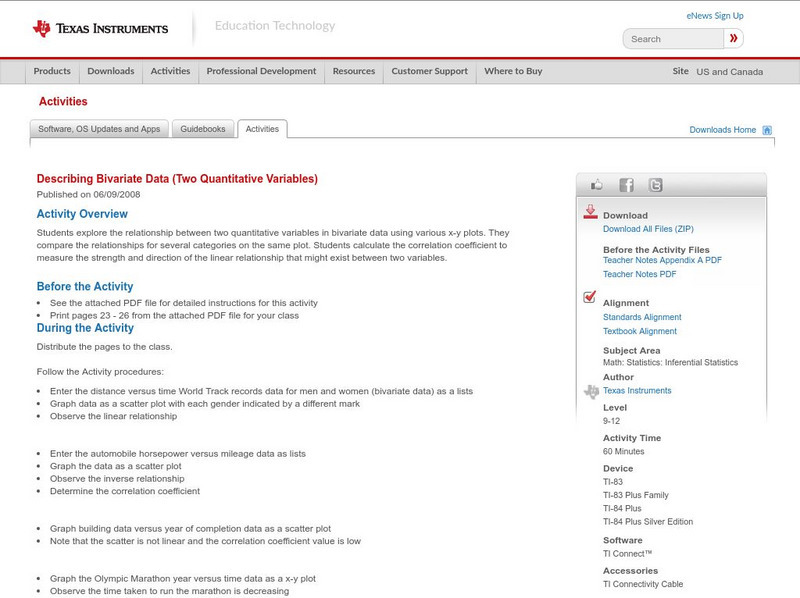
Texas Instruments: Describing Bivariate Data (Two Quantitative Variables)
Students explore the relationship between two quantitative variables in bivariate data using various x-y plots. They compare the relationships for several categories on the same plot. Students calculate the correlation coefficient to...
Illustrative Mathematics
Illustrative Mathematics: S Id.6 Used Subaru Foresters
Help Jane sell her Forrester! Using the data given, students will make an appropriate plot with well-labeled axes that would allow you to see if there is a relationship between price and age and between price and mileage. Students are...
Illustrative Mathematics
Illustrative Mathematics: S Id Coffee and Crime
This task addresses many standards regarding the description and analysis of bivariate quantitative data, including regression and correlation. Given a scatter plot, students will answer a variety of questions about linear relationships,...
CK-12 Foundation
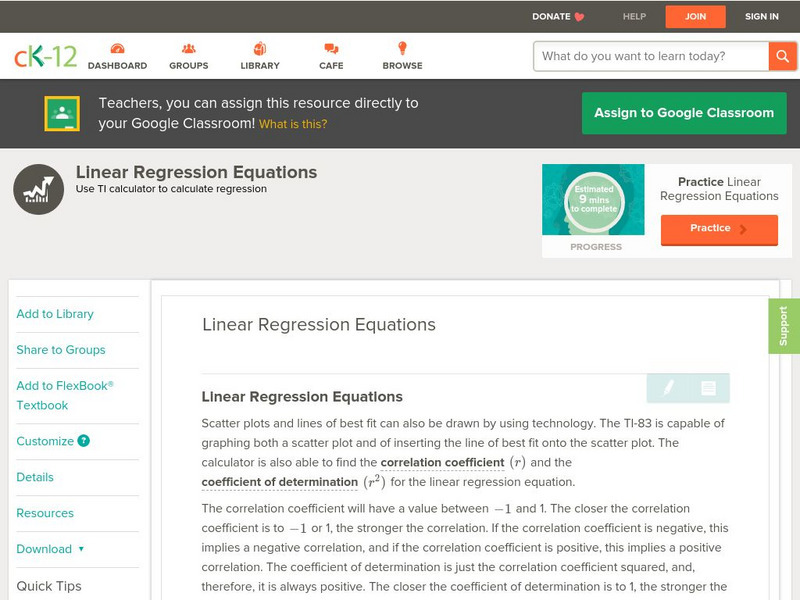
Ck 12: Statistics: Linear Regression Equations
[Free Registration/Login may be required to access all resource tools.] Use a calculator to create a scatter plot and to determine the equation of the line of best fit.
Thinkport Education
Thinkport: Algebra Ii: Linear, Quadratic and Exponential Regression
Review linear regression and analyze how well this model fits the data. You will also be introduced to residuals and the correlation coefficient, and use these tools to determine whether or not a linear model is the best fit for a set of...


