American Physiological Society
Effects of Environment on Enzymes
Much like the tale of Humpty Dumpty, proteins, once altered, will never be the same again. Honors and pre-AP biology classes explore the delicate world of enzymes via a Webquest and lab experiment. The teacher's guide contains...
Biology Corner
Pipe Cleaner Babies
Ever been told you have your father's eyes? How did it happen? Young biologists get a hands-on experience in meiotic gene expression with a fun pairs-based activity. Participants use pipe cleaner chromosomes with trait beads to make...
Curated OER
Inside OKCupid: The Math of Online Dating
Capture the hearts of your young statisticians with this real-life example of using statistics in online dating. The use of average and geometric mean are discussed in the context of creating the algorithm used to connect people.
Curated OER
Introduction to Representing and Analyzing Data
Represent data graphically. Allow your class to explore different methods of representing data. They create foldables, sing songs, and play a dice game to reinforce the measures of central tendency.
Curated OER
Building Brilliant Bar Graphs
Everything you need for a mini-unit on bar graphs is included in this lesson plan! It outlines three lessons and includes worksheets. Learners taste pretzels, shoot baskets (switching off hands), and grab candy, graphing results...
Workforce Solutions
Miniature Gulf Coast Project
Scholars show what they know about data collection and analysis with an activity that examines a smaller population of Houghton, Texas. Independently or in pairs, learners identify their research question, gather, graph, and analyze...
NASA
Developing an Investigation
Watch as your class makes the transition from pupils to researchers! A well-designed instructional activity has scholars pick a solar wind characteristic to research. They then collect and analyze official data from the LANL...
Michigan State University
In Search of Life
Explore the habitats around you with an activity that takes kids out of the classroom to learn about the local variety of habitats and the living things that call them home. In small groups, scholars investigate their surroundings,...
Code.org
Cleaning Data
"Clean the data!" "I did not know it was dirty." Introduce your class to the process of cleaning data so that it can analyze it. Groups work through a guide that demonstrates the common ways to filter and sort data. Pairs then...
Noyce Foundation
Granny’s Balloon Trip
Take flight with a fun activity focused on graphing data on a coordinate plane. As learners study the data for Granny's hot-air balloon trip, including the time of day and the distance of the balloon from the ground, they practice...
National Security Agency
Starting a Restaurant
Through an engaging unit, chefs-in-training will sort and classify data using tally charts. Learners will also create bar graphs to display restaurant data and interpret data from bar graphs using a variety of categories....
Curated OER
Describing Data
Your learners will practice many ways of describing data using coordinate algebra in this unit written to address many Common Core State Standards. Simple examples of different ways to organize data are shared and then practice problems...
Student Handouts
The Five W's and How
Here is a great graphic organizer for ensuring that young researchers and writers cover all their bases when brainstorming a topic by considering the five W's (who, what, where, when, and why) and how.
Math Moves U
Collecting and Working with Data
Add to your collection of math resources with this extensive series of data analysis worksheets. Whether your teaching how to use frequency tables and tally charts to collect and organize data, or introducing young...
National Security Agency
Line Plots: Frogs in Flight
Have a hopping good time teaching your class how to collect and graph data with this fun activity-based lesson plan series. Using the provided data taken from a frog jumping contest, children first work...
Curated OER
Tallies
Tally Marks are a wonderful way to keep track of data, and to foster counting for your young mathematicians. This resource has learners identify the correct number of tally marks for a given number. The numbers used are: 13, 15, 17, and...
Curated OER
Data Squares
Middle and high schoolers examine how data squares organize and sort information and data sets. They discuss examples of data squares, complete a data square about themselves, organize the data squares for the class together, and compile...
Curated OER
School Activities
First graders place some specific types of objects (e.g., shoes, favorite food) on concrete graphs and pictographs. They listen and respond to others in a variety of contexts (e.g., pay attention to the speaker; take turns speaking in a...
Curated OER
Beans and Baleen
Predict whale populations using different beans as whales! Learners observe different types of beans in a dish knowing that each bean represents a different kind of whale. They then predict how many "whales" there are in a certain area....
Curated OER
Can You Count on Cans?
How can a canned food drive be connected to math? It's as simple as counting and organizing the cans! Children demonstrate their ability to sort non-perishable foods into categories that include soup cans, vegetable cans, boxed items,...
Curated OER
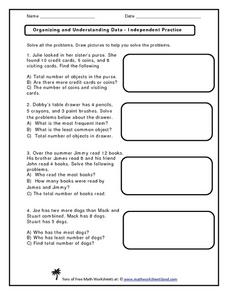
Organizing and Understanding Data - Independent Practice
Provide your first graders with an opportunity for independent practice organizing and understanding data. The ten story prompts on this three-page worksheet asks learners to solve problems involving concepts of the total number of...
Curated OER
Probability
Here is a classic activity used to introduce your class to the concept of probability and data collection. They will roll one die 30 times, then record and discuss the results. Great introduction, but too shallow to be considered a...
Pennsylvania Department of Education
Use Order of Operations to Evaluate Expressions—No Grouping Symbols
Students identify and explain different types of data collection and graphs. In this graphs and data collection lesson plan, students record their observations of a variety of data collection tools and graphs displayed in the room....
Curated OER
When is Your Birthday?
Students use data about their birthdays to create graphs. In this collecting and communicating information instructional activity, students make a class list of their birthdays. Students use the information to make a bar graph showing...


