Prince Edward Island
Fact Learning, Mental Computation, Estimation
Need help with mental math in your classroom? This guide is full of tips, tricks, and examples to help the teacher encourage learners to use their brain instead of a calculator. Practice problems are included with reasons how to use...
Math Worksheets Land
My Favorite Animal At The Zoo Pie Graph
What is your favorite animal at the zoo? Young mathematicians answer eight multiple choice questions, based on a survey of 50 people presented in a pie graph. Additionally, the graph does not display any numbers, but rather different...
International Technology Education Association
Sizing Up the Clouds
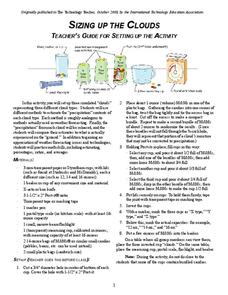
How much rain can that cloud make? Through a simulation, the class estimates the amount of candy rain contained in different cup clouds. After probing the clouds using different methods, class members adjust their estimates. Participants...
Virginia Department of Education
Practical Problems Involving Decimals
After discussing decimals and "going shopping" in the classroom, young mathematicians are given four practical word problems that require them to estimate their answers, given specific information. The highlight of the lesson is having...
Illustrative Mathematics
How Thick Is a Soda Can I?
The humble soda can gets the geometric treatment in an activity that links math and science calculations. After a few basic assumptions are made and discussed, surface area calculations combine with density information to develop an...
Illustrative Mathematics
Accuracy of Carbon 14 Dating II
The scientific issue of carbon-14 dating and exponential decay gets a statistics-based treatment in this problem. The class starts with a basic investigation of carbon content, but then branches out to questions of accuracy and ranges of...
Curated OER
Using Random Sampling to Draw Inferences
Emerging statisticians develop the ability to make inferences from sample data while also working on proportional relationships in general. Here, young learners examine samples for bias, and then use random samples to make inferences...
Illustrative Mathematics
How Many Leaves on a Tree? (Version 2)
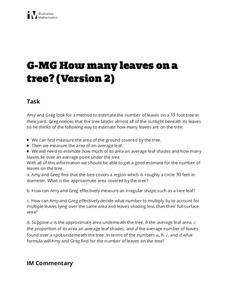
A second attack at figuring out the number of leaves on a tree, this activity makes both an excellent follow-up to version 1 and a stand-alone activity. Learners practice setting parameters and deciding acceptable estimate precision, and...
Illustrative Mathematics
How Many Leaves on a Tree?
This is great go-to activity for those spring or fall days when the weather beckons your geometry class outside. Learners start with a small tree, devising strategies to accurately estimate the leaf count. They must then tackle the...
K12 Reader
Estimation
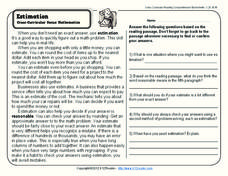
When is it a good idea to use estimation? Learn about estimation and rounding with a reading comprehension lesson. After kids read a passage about estimation, they answer five comprehension questions on the other side of the page.
Kiz Club
Candy Jar Counting
How many candies are in the jar? Included here is an image of a jar to which you can add paper candies. Learners can practice estimating and adding skills.
K12 Reader
Estimation
Teach your class a thing or two about making educated mathematical guesses. Learners read a passage that explains estimation and approximate and exact answers. They then respond to five questions about and related to the text.
Virginia Department of Education
Adding and Subtracting Fractions
Your learners will enjoy playing a game as a motivator to learning and remembering the adding and subtracting of fractions.
National Security Agency
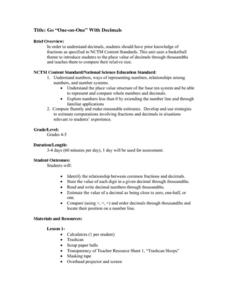
Go One-on-One with Decimals
Shoot and score with three basketball-themed lessons about decimals. Young mathematicians compare game statistics, make trash can hoops, and play a data spinner game to practice identifying digits and values within decimal numbers.
Alberta Learning
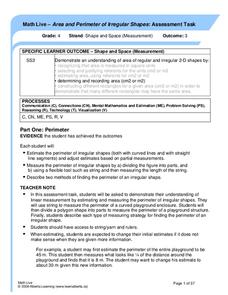
Area and Perimeter of Irregular Shapes
Evaluate young mathematicians' understanding of area and perimeter with this series of three assessment tasks. Challenging learners to not only calculate the area and perimeter of irregular shapes, but to explain in writing their...
Math Learning Center
Grade 5 Supplement Set A3 – Number and Operations: Estimating to Multiply and Divide
Teach young mathematicians that sometimes just getting close to the exact answer is perfectly fine, by using this collection of estimation worksheets.
Shodor Education Foundation
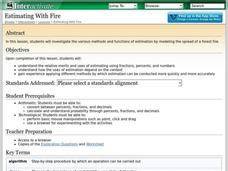
Estimating With Fire
Watch the damage from a forest fire in this interactive simulation activity that challenges learners to estimate the burn area using different approaches. Learners are given a worksheet to track the different burn patterns and practice...
Curated OER
How Does Water Cool?
How fast does water cool? First fifth graders will draw a line on a graph that predicts how fast they think water can cool from boiling. Then they plot the actual data on the same graph to see if their estimate was correct.
Curated OER
Guess-timating Fun
Learners estimate the number of items in a jar and write their estimate boldly on a piece of paper. They line up holding their numbers. Then, they calculate the median, mean, mode and average of the guesses.
Curated OER
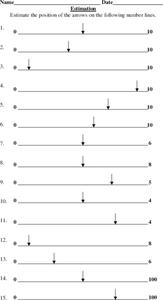
Estimation Number Lines
Here is a good two-page worksheet in which learners are given 30 number lines. The number on the left is always zero, but the number at the far right is different each time. There is an arrow placed pointing down at each number line, and...
Curated OER
Picture Graphs
An innovative way to practice reading data, as well as the four operations! Three picture graphs prompt first graders to count marbles, books, and pets. They also solve addition and subtraction problems. Additionally, they work on...
Curated OER
Estimating Sums and Differences
Work on rounding, estimating, adding, and subtracting with a helpful math worksheet! Fifth graders study different sets of addition and subtraction problems, and after rounding each number to the leading digit, they estimate what the sum...
Curated OER
M&Ms Count and Crunch
Middle schoolers practice skills involving statistics and probability by making predictions on number of each color candy in one pound bag of M&Ms. They record both guesses and actual quantities, calculate percentages, and create bar...
Curated OER
Using Bar Graphs
What's your favorite pizza topping? Scholars analyze two bar graphs, one depicting a math club's favorite pizza toppings and the other ice cream sales per flavor. As they examine the graphs, learners answer a few comprehension questions....


