PBS
Math with Jake: Frequencies and Pitch
Be an octave above the rest. A musician explains how to write music in different time signatures. An interesting resource continues to demonstrate ratios using the pitch of musical notes and hertz. Pupils use a pitch table and determine...
PBS
Math with Jake: Transposition Using Ratios
The star of the show is ratios. The informative resource explains how to transpose music using ratios. Individuals transpose the song "Twinkle, Twinkle" in the activity by applying their ratio skills. The activity challenges class...
Pingry School
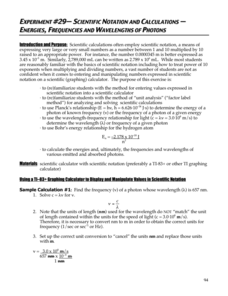
Scientific Notation and Calculations – Energies, Frequencies, and Wavelengths of Photons
The calculator has an interesting way of displaying numbers in scientific notation, but don't let that confuse your pupils! A lesson designed to give learners practice with scientific notation and calculators provides several practice...
Glynn County School System
Multi-Wavelength Astronomy
Take a look at astronomy through the light lens. From radio to gamma, light waves exist in every corner of the universe. An enlightening PowerPoint presentation gives an overview of the different categories of light and then discusses...
Magic of Physics
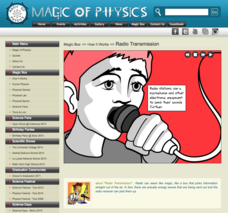
Radio Transmission
Radio waves are all around us! How do they transmit sound? Using an interactive, scholars examine how songs travel through the air. The resource explains the process from the radio station, to signal towers, to the radio unit. A look at...
Mathematics Vision Project
Module 9: Modeling Data
How many different ways can you model data? Scholars learn several in the final module in a series of nine. Learners model data with dot plots, box plots, histograms, and scatter plots. They also analyze the data based on the data...
Physics Classroom
Name That Harmonic: Open-End air Columns
Ever wonder what really goes on inside a clarinet? Show your young scientists the physics of open-end air columns through an easy-to-use interactive. Learners examine the features of standing waves and calculate frequency and length in a...
Physics Classroom
Name That Harmonic: Strings
Don't string your class along! Physics scholars discover the fascinating forces behind the music of stringed instruments using an interactive. From a series covering sounds and waves, the interactive asks users to identify nodes and...
Physics Classroom
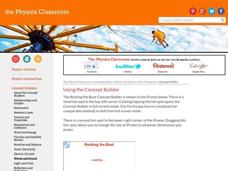
Rocking the Boat
Sometimes it's okay to rock the boat! Science scholars manipulate wave properties using a fun interactive. Part of a larger playlist that dives into waves and sound, the lesson helps users work their way from apprentice to wizard by...
Physics Classroom
Waves - Case Studies
What can your class tell about a wave just by looking at it? Using a simulation, physics pupils work through a series of case studies to determine the effects of speed, frequency, and density on waves. Part of a larger playlist on waves...
Physics Classroom
Wavelength
Physics class sure can have its ups and downs! The first in a series of seven interactives from the Waves and Sound series introduces young learners to the concept of wavelength. Scholars work through the interactive to discover the...
Cornell University
Sound Off!
Time to witness the effects of sound. Learners analyze different materials to determine their abilities to absorb sound waves. They use free software to monitor the amplitude of the waves to verify results.
Cornell University
Sound Waves
How does sound travel through different mediums? Scholars explore this question by creating and observing sound waves as they learn the difference between transverse and longitudinal wave motion. Using their new knowledge, class members...
Cornell University
Light Waves: Grades 9-12
Explore the behavior of light waves with a lab activity. Scholars build new vocabulary through experimentation and observation. Using different mediums, they model reflection, refraction, transmission, diffusion, and scattering of light.
Cornell University
Diffraction Demystified
Study diffraction patterns using CDs and DVDs! Scholars measure the diffraction patterns of a light wave as it hits a CD or DVD. Using the information, they can measure the distance between the tracks.
CK-12 Foundation
Line Plots from Frequency Tables: Sleep Cycles
Demonstrate the ease of using a frequency table. An interactive lesson allows learners to create a frequency table efficiently. Challenge questions ask your classes to analyze the data represented in the frequency table.
CK-12 Foundation
Frequency Polygons: Constructing a Frequency Polygon
Connect the dots on frequency. Given a distribution table of scores on an assessment, learners create a frequency polygon by moving points on a graph to the correct frequency. The pupils use the display to answer questions about the...
CK-12 Foundation
Understand and Create Histograms: Histograms
Tally ho! Represent the frequency of ages at school. Pupils finish a tally chart to match the frequencies of ages at school. Using the frequencies, the learners create a histogram. With the aid of the histogram and the frequency table,...
CK-12 Foundation
Data Summary and Presentation: Chart for Grouping Data
Get social! Create a display of social media use for a class. Pupils use provided information about the time spent on social media to construct a histogram. Using the histogram, learners interpret the data to answer questions.
NASA
What's the Frequency, Roy G. Biv?
While all light travels at the same speed, each color in the visible light spectrum contains a different wavelength and frequency. Scholars determine the relationship between frequency and wavelength as they complete the activity. They...
Columbus City Schools
Making Waves
Learning about waves can have its ups and downs, but a demo-packed tool kit has the class "standing" for more! Learners gain experience with several different wave types, organizing observations and data, and wave...
CK-12 Foundation
Light Wave
Do radio waves create light? It's more difficult to understand the things we can't see than those that we can. The simulation compares the relatively small range of visible light to the entire electromagnetic spectrum. It graphs the size...
CK-12 Foundation
Stow Lake
Does the depth of a pond matter to the waves created when rain is falling? Many people assume the answer is no, but interestingly, it does matter. Pupils explore this concept and other variables related to wave behavior through a...
EngageNY
Describing a Distribution Displayed in a Histogram
The shape of the histogram is also relative. Learners calculate relative frequencies from frequency tables and create relative frequency histograms. The scholars compare the histograms made from frequencies to those made from relative...


