Curated OER
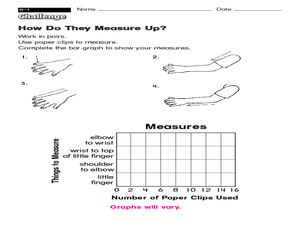
How Do They Measure Up? Measure and Graph
In this measure and graph worksheet, students use paper clips to measure various lengths shown, then bar graph their results, a total of 4 measurements.
Curated OER
Halloween Graphitti
Students complete multi-curricular activities in a Halloween themed lesson. In this Halloween lesson, students examine newspaper ads to find prices of pumpkins and use them to complete a stem and leaf plot. Students find the diameter,...
Curated OER
Ice Cream Scoop
In this data display learning exercise, students write 6 flavors of ice cream on pieces of paper. Kids choose papers one at a time and keep track on a tally sheet. Students make a bar graph of the results.
Curated OER
Fore!
In this golf worksheet, students fill in data in a chart about 6 tournaments and answer short answer questions about it. Students fill in 18 spaces in the chart and answer 2 questions.
Curated OER
Population Dilemma
Ninth graders explore population growth. In this Algebra I activity, 9th graders conduct an experiment simulating population growth. Students create a model and relate the results to a real-world situation. ...
Curated OER
Use a Bar Graph
In this bar graph worksheet, students use a given bar graph to answer a set of 3 questions. Answers included on page 2.A reference web site is given for additional activities.
Curated OER
Problem Solving Application: Using a Bar Graph
In this bar graph worksheet, students use a set of 2 bar graphs to answer 6 related questions. Answers are included on page 2. A reference web site is given for additional activities.
Curated OER
Character Development-Nanavi, A Girl from Benin, West Africa
Learners examine the ways a character changes throughout the course of a story. In this literary analysis lesson, students discuss a story that spans three years in a young girl's life. Learners analyze the changes the girl...
Curated OER
Comparison of Two Different Gender Sports Teams - Part 3 of 3 Scatter Plots and Lines of Best Fit
Pupils create a scatter plot for bivariate data and find the trend line to describe the correlation for the sports teams. In this scatter plot instructional activity, students analyze data, make predictions,and use observations...
Curated OER
Meter Reading Using Place Value
Fourth graders watch a video about reading a gas meter and discuss what they saw in the clip. In this place value lesson, 4th graders complete a worksheet where they fill in the missing dials on the meters.
Curated OER
Handling Data: Collecting and Recording Data
Students collect and record data. For this collecting and recording data lesson, students collect data and record that data using frequency tables which include the x and y axis.
Curated OER
Properties of Logarithms
Young scholars explore the concept of logarithms. In this logarithms lesson plan, students graph logarithms on their Ti-Nspire calculator. Young scholars describe the shapes of their graphs by identifying slope, y-intercepts,...
Curated OER
Excel Turns Data Into Information
Pupils use excel to analyze data. In this technology lesson, students enter data into the excel program to find averages and organize data.
Curated OER
Completing frequency diagrams from displayed data
In this frequency worksheet, students use data in graphs and charts to complete a frequency diagram. Students fill in 26 spaces in the diagram.
Curated OER
Canada Recycles! Do You?: Grades 4-6
In this recycling education worksheet, students read a table regarding Canadian recycling statistics and respond to 9 questions regarding the data.
Curated OER
Circle Graphs
Sixth graders interpret, create, and display data in a circle graph. In this circle graph lesson plan, 6th graders use a compass, protractors, pizza boxes, and more to create a circle graph and analyze the data they put into it.
Curated OER
Sorting and Graphing Animals
Students inquire about animals using SIRS Discoverer or eLibrary Elementary. In this organizing data lesson, students sort pictures of animals in various ways and develop graphs. Students locate a mammal, reptile, fish, insect or...
Curated OER
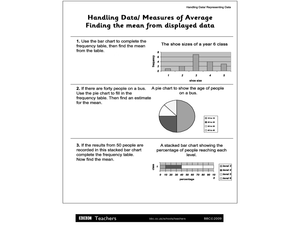
Handling Data/Measures of Average - Finding the Mean from Displayed Data
In this mean and average worksheet, students use the bars and charts to help them find the means using the given data. Students solve 3 problems.
Curated OER
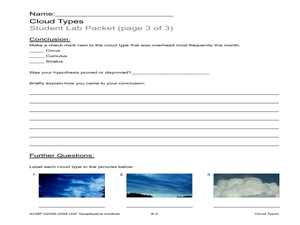
Cloud Types
Students examine cloud types. In this cloud lesson plan, students identify cloud types, observe clouds and collect data, and analyze data to identify the most common cloud they observe overhead during the course of a month.
Curated OER
Paying Attention to Scale
Students create bar graphs. In this graphing lesson, students watch video clips about bar graphs and complete worksheets. The focus of this lesson is on creating the correct scale for the bar graph and correctly labeling the axes.
Alabama Learning Exchange
The State Capital of Stem and Leaf
Students explore the concept of stem and leaf plots. In this stem and leaf plots lesson, students plot the 50 US states' capitals on a stem and leaf plot according to the first letter of each state. Students compare...
Curated OER
A Planet Full of Animals
Students study animals and practice classifying them through observation activities. In this animal classification lesson, students complete a KWL chart about animals. Students then sort pictures of animals into chart categories based on...
Curated OER
Savings Planning Using Tables, Line Graphs and Early Proportionality
Students use proportional reasoning to make a chart of daily savings transactions and balances. In this accounting lesson, students read word problems and complete three handouts about a bidding and accounting problem. Students finish...
Curated OER
Diagnosing Allergies Through Data Collection
Students research and organize information about allergies. In this data collection lesson, students watch a video about allergies. Students create a histogram using the information collected. Students complete the 'Displaying Survey...


