Curated OER
Planning Pens for the Petting Zoo
In this planning pens for the petting zoo worksheet, 3rd graders follow directions to solve the logic puzzle about placing letters on a grid to represent animal pens.
Curated OER
Bar Graph: Vacation Fun
In this bar graph worksheet, students use a bar graph showing pictures taken on a vacation to complete 6 related questions. Answers are included on page 2.
Curated OER
Working Out The Workout: Chart Activity
In this chart worksheet, students complete one column in a chart to determine total hours of exercise time, then use the chart to complete 4 additional questions.
Curated OER
Circle Graph: Snoozing Animals
In this circle graphs worksheet, students make a circle graph for each animal shown in a chart showing average number of hours each animal sleeps and is awake.
Curated OER
Create a Bar Graph
In this bar graph activity, students use a set of clues about favorite types of books to draw the bars on a graph. Answers are included on page 2.
Curated OER
Line Graph: To Grandmother's House We Go
In this line graph worksheet, students use a line graph showing distance traveled to answer a set of 4 related questions. Answers are included on page 2.
Curated OER
Reading Graphs
For this reading graphs practice worksheet, students examine a graph and respond to 5 questions that require them to record the coordinates of 5 shapes on the gridded graph.
Curated OER
Bar Graph Activity: Spelling Bee
In this bar graph worksheet, students use information about a class spelling bee, shown in a bar graph, to complete a set of 7 related questions. Answers included on page 2.
Curated OER
Surveys and Samples
In this surveys and samples worksheet, students discover data collection techniques and write their own survey questions. Students use random sampling, convenience sampling, and systemic sampling and analyze their results.
Curated OER
How Do They Measure Up? Measure and Graph
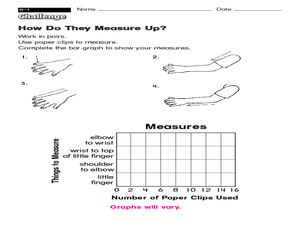
In this measure and graph worksheet, students use paper clips to measure various lengths shown, then bar graph their results, a total of 4 measurements.
Curated OER
Halloween Graphitti
Students complete multi-curricular activities in a Halloween themed lesson. In this Halloween lesson, students examine newspaper ads to find prices of pumpkins and use them to complete a stem and leaf plot. Students find the diameter,...
Curated OER
Ice Cream Scoop
For this data display worksheet, students write 6 flavors of ice cream on pieces of paper. Students choose papers one at a time and keep track on a tally sheet. Students make a bar graph of the results.
Curated OER
Fore!
In this golf learning exercise, students fill in data in a chart about 6 tournaments and answer short answer questions about it. Students fill in 18 spaces in the chart and answer 2 questions.
Curated OER
Population Dilemma
Ninth graders explore population growth. In this Algebra I activity, 9th graders conduct an experiment simulating population growth. Students create a model and relate the results to a real-world situation. Students create a scatter...
Curated OER
Use a Bar Graph
In this bar graph worksheet, students use a given bar graph to answer a set of 3 questions. Answers included on page 2.A reference web site is given for additional activities.
Curated OER
Problem Solving Application: Using a Bar Graph
In this bar graph worksheet, students use a set of 2 bar graphs to answer 6 related questions. Answers are included on page 2. A reference web site is given for additional activities.
Curated OER
Character Development-Nanavi, A Girl from Benin, West Africa
Students examine the ways a character changes throughout the course of a story. In this literary analysis lesson, students discuss a story that spans three years in a young girl's life. Students analyze the changes the girl experiences...
Curated OER
Comparison of Two Different Gender Sports Teams - Part 3 of 3 Scatter Plots and Lines of Best Fit
Students create a scatter plot for bivariate data and find the trend line to describe the correlation for the sports teams. In this scatter plot lesson, students analyze data, make predictions,and use observations about sports data...
Curated OER
Meter Reading Using Place Value
Fourth graders watch a video about reading a gas meter and discuss what they saw in the clip. In this place value lesson, 4th graders complete a worksheet where they fill in the missing dials on the meters.
Curated OER
Handling Data: Collecting and Recording Data
Young scholars collect and record data. In this collecting and recording data lesson, students collect data and record that data using frequency tables which include the x and y axis.
Curated OER
Properties of Logarithms
High schoolers explore the concept of logarithms. In this logarithms lesson, students graph logarithms on their Ti-Nspire calculator. High schoolers describe the shapes of their graphs by identifying slope, y-intercepts, and roots. ...
Curated OER
Excel Turns Data Into Information
Learners use excel to analyze data. In this technology lesson, students enter data into the excel program to find averages and organize data.
Curated OER
Completing frequency diagrams from displayed data
In this frequency worksheet, students use data in graphs and charts to complete a frequency diagram. Students fill in 26 spaces in the diagram.
Curated OER
Canada Recycles! Do You?: Grades 4-6
In this recycling education instructional activity, students read a table regarding Canadian recycling statistics and respond to 9 questions regarding the data.


